Data is (not always) beautiful.
Rui Qiu
Updated on 2021-09-26.
There are so many aspects to cover when it comes to exploratory data analysis. Some might give the analyst an unseen new perspective, and some might need their prior knowledge before plotting.
Script: shots-viz.R
Although it is called "shots-viz", it contains all the coding used in this part.
Location-based shot attempts
Back to the very core of the model to build, it is vital to show shot attempts whether it is a success or failure.
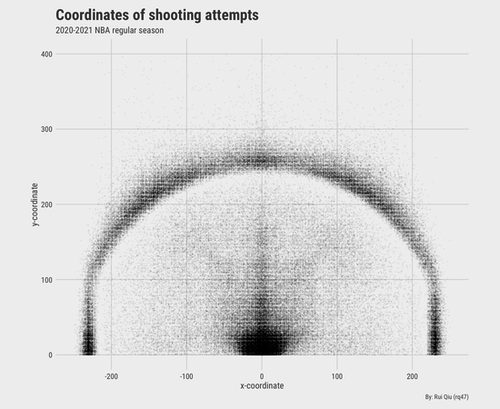
To keep the plot visually pleasing, the area restricted by the coordinates is made close to a square. Some records are backcourt "yeets," which usually happen when a quarter runs out and the offensive team does not have enough time to organize an attack. In this case, the ball-controlling player will desperately throw the ball as hard as towards the rim to try his luck. Thus some of the data are discarded as a result.
Washington Wizards' shooting locations
As the data are split by teams, it is very handy to load and plot a team's performance in a season. Let's take Washington Wizards as an example.

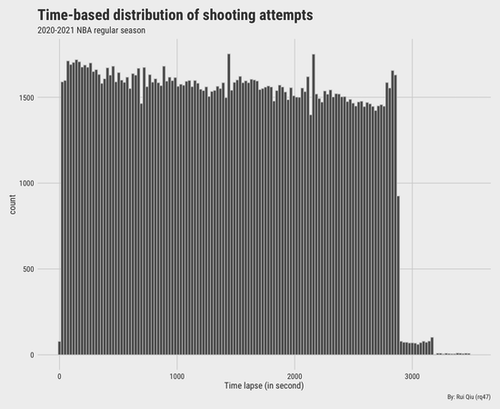
Time-based shot attempts
Another angle to look at the data as a whole is to check when those shots are taken. An NBA has four quarters, and each quarter has 12 minutes. If the score is a draw at the end of 4 quarters, another 5 minutes of overtime (OT) will be added to the game. The number of OTs can go on and on. Each time has no more than 24 seconds to run the attack as long as they still have possession of the ball. So, in general, the distribution should be uniform from the second 0 to 2880. But due to some tactical reasons, one team might hold the ball a little longer than or shorter (like run-and-gun), so that's where the teams differ.
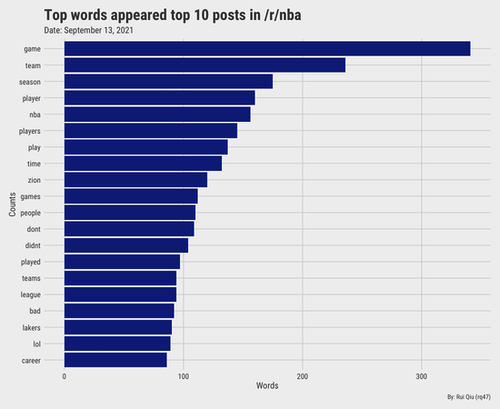
Most frequent words in /r/nba
This is data from one day only. The plot reflects what the popular topics are about on that day.
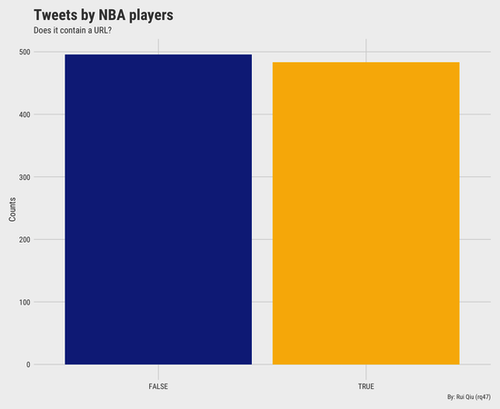
With or without URLs
The label of players' tweets is whether a tweet contains a URL. The bar chart shows that it's almost a 50-50 situation. Plain and simple.
For the players' name and id, frankly speaking, there is nothing to visualize for now. It's just a reference.
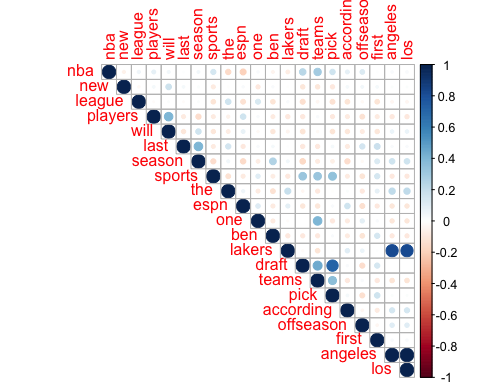
Correlation of top features in a DTM
For the last plot, it's somewhat interesting to see the correlation between the frequent features of a document-term matrix. The more blue the dot is, the more positively correlated the two terms are, like "los" and "angeles."
In the end
To conclude, the plots drawn in this part of the portfolio are rather sketchy. Nonetheless, they still managed to keep some formality, as the plotting style. Are there any brilliant observations emerging from the data? Maybe not. Still, this is just a preliminary step before modeling.