A tale of two classifiers part 2
Rui Qiu
Updated on 2021-11-21.
This part of the portfolio continues what’s left in the previous one, to make the following two predictions with support vector machine classifiers:
- To predict the shot attempt results of Toronto Raptors (2020-2021 season).
- To predict the popularity of reddit threads based on its title.
Mixed record data with R
Data and scripts
- Data: team-shots-TOR.csv
- Script: nb-svm-script.R
The data is the same as the one used in last part of the portfolio. The data consists of Toronto Raptors’ shot attempt data (mostly from 2020-2021 season) with the following general structure (with both numeric and categorical features):
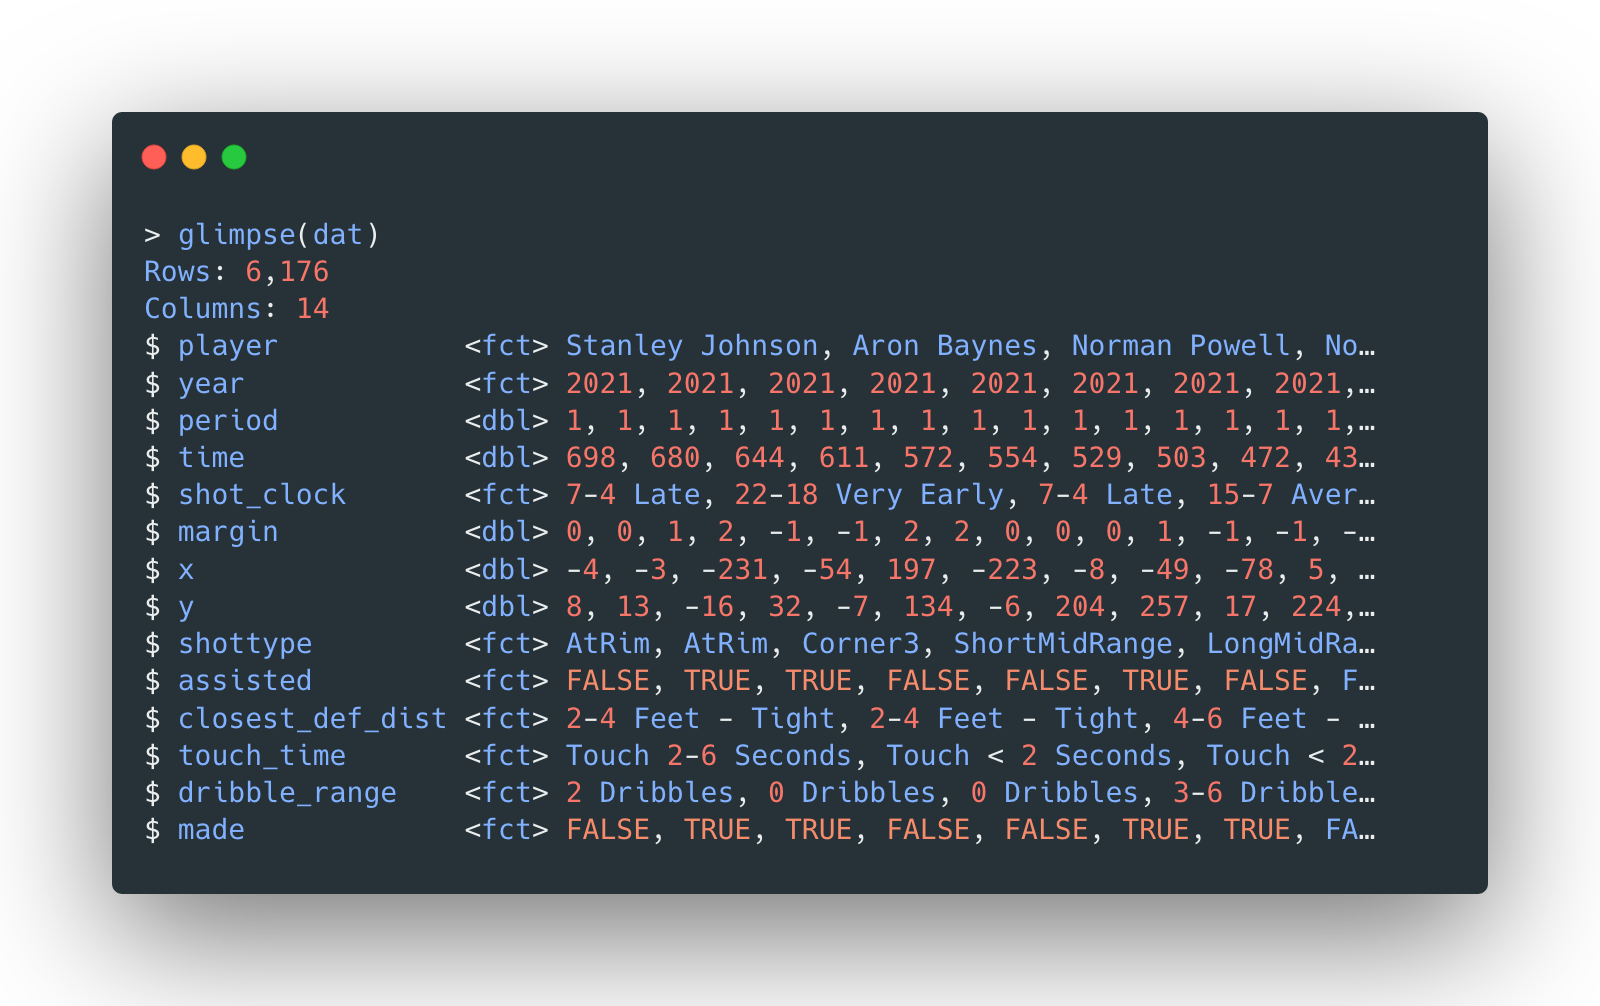
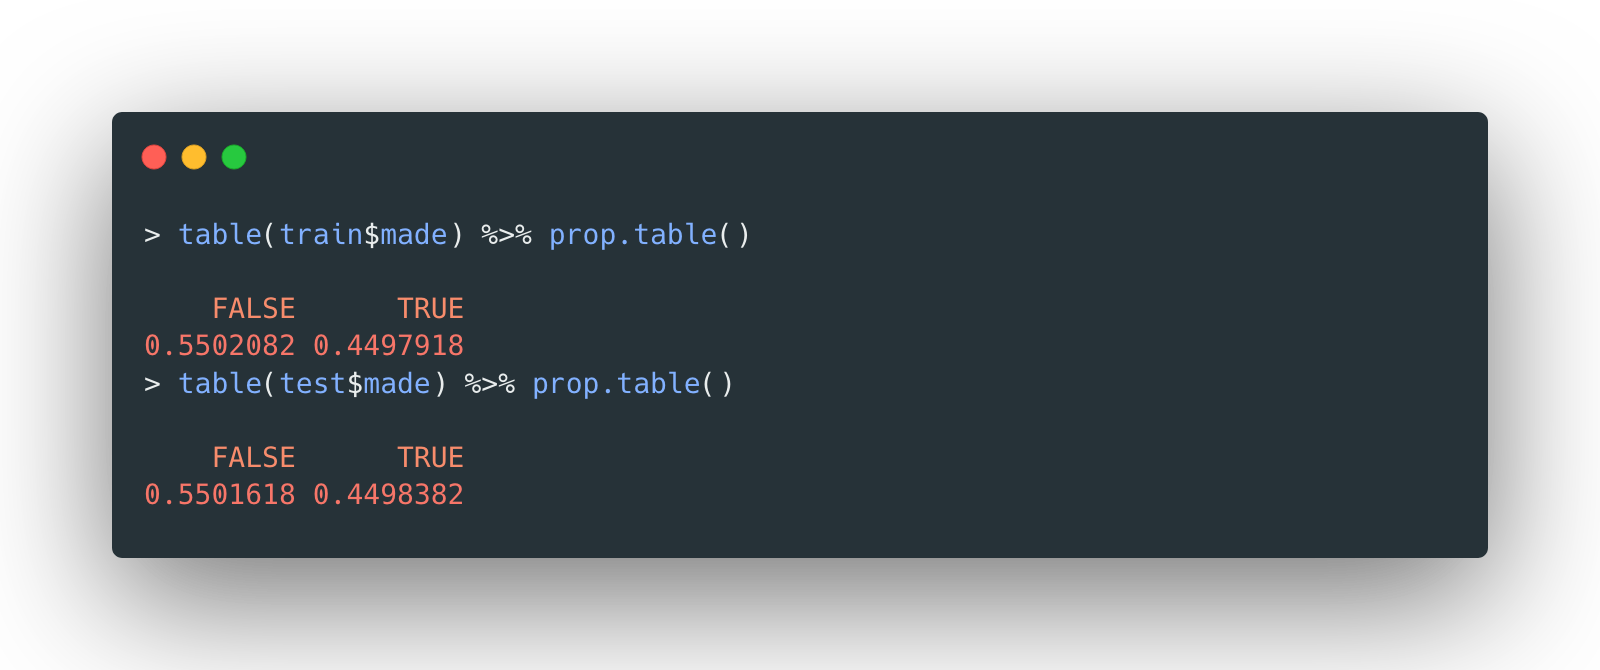
The data set is also split into a 70-30 train-test split, stratified by the result
made.
In fact, since the data is inherited from preprocessed data of naïve Bayes classifier, all the numeric features are standardized. And the rest of the features are categorical.
Model 1 - linear kernel tuning
Three types of kernels will be tested in the model selection today. They are linear, radial and polynomial. For each kernel, the tuning process will use a grid search to test different sets of hyperparameters as always.
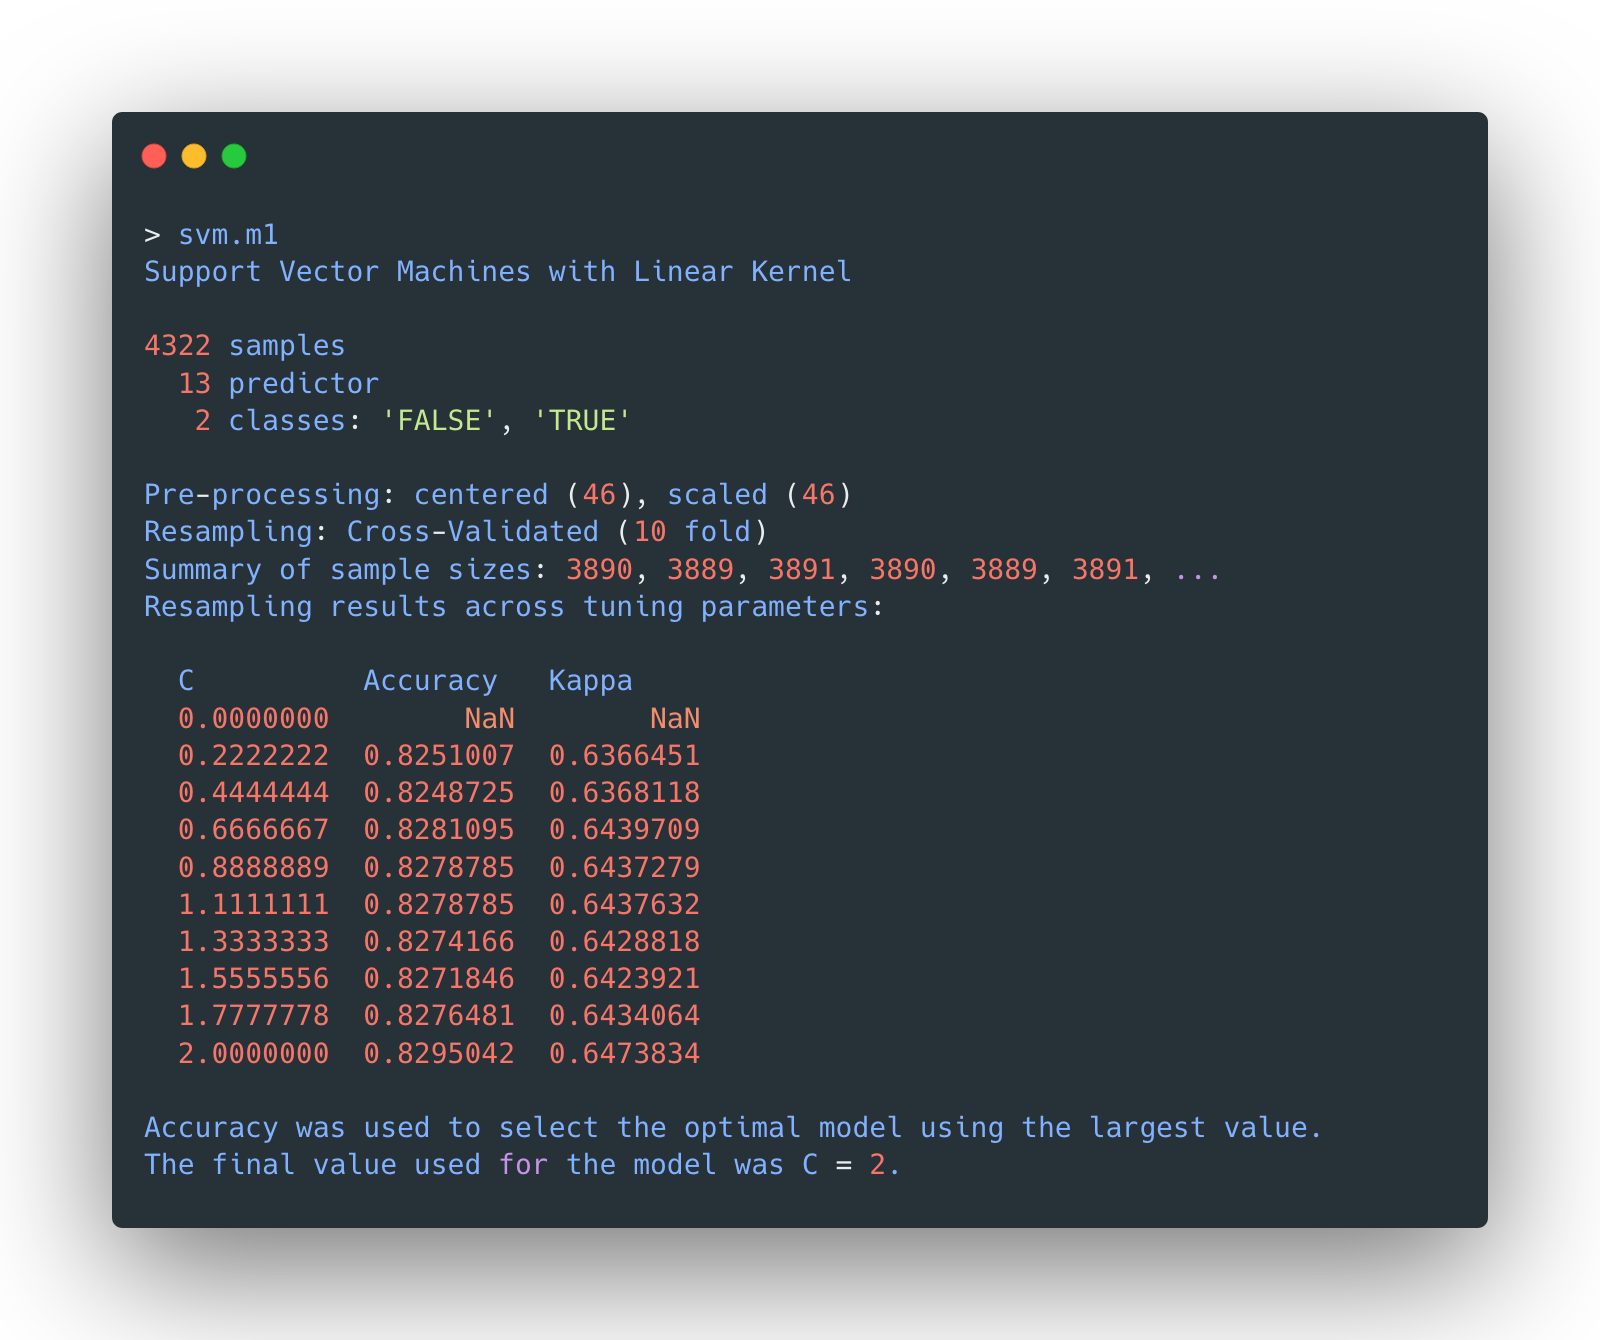
The first one to be tested is the linear SVM, with cost from 0 to 2:
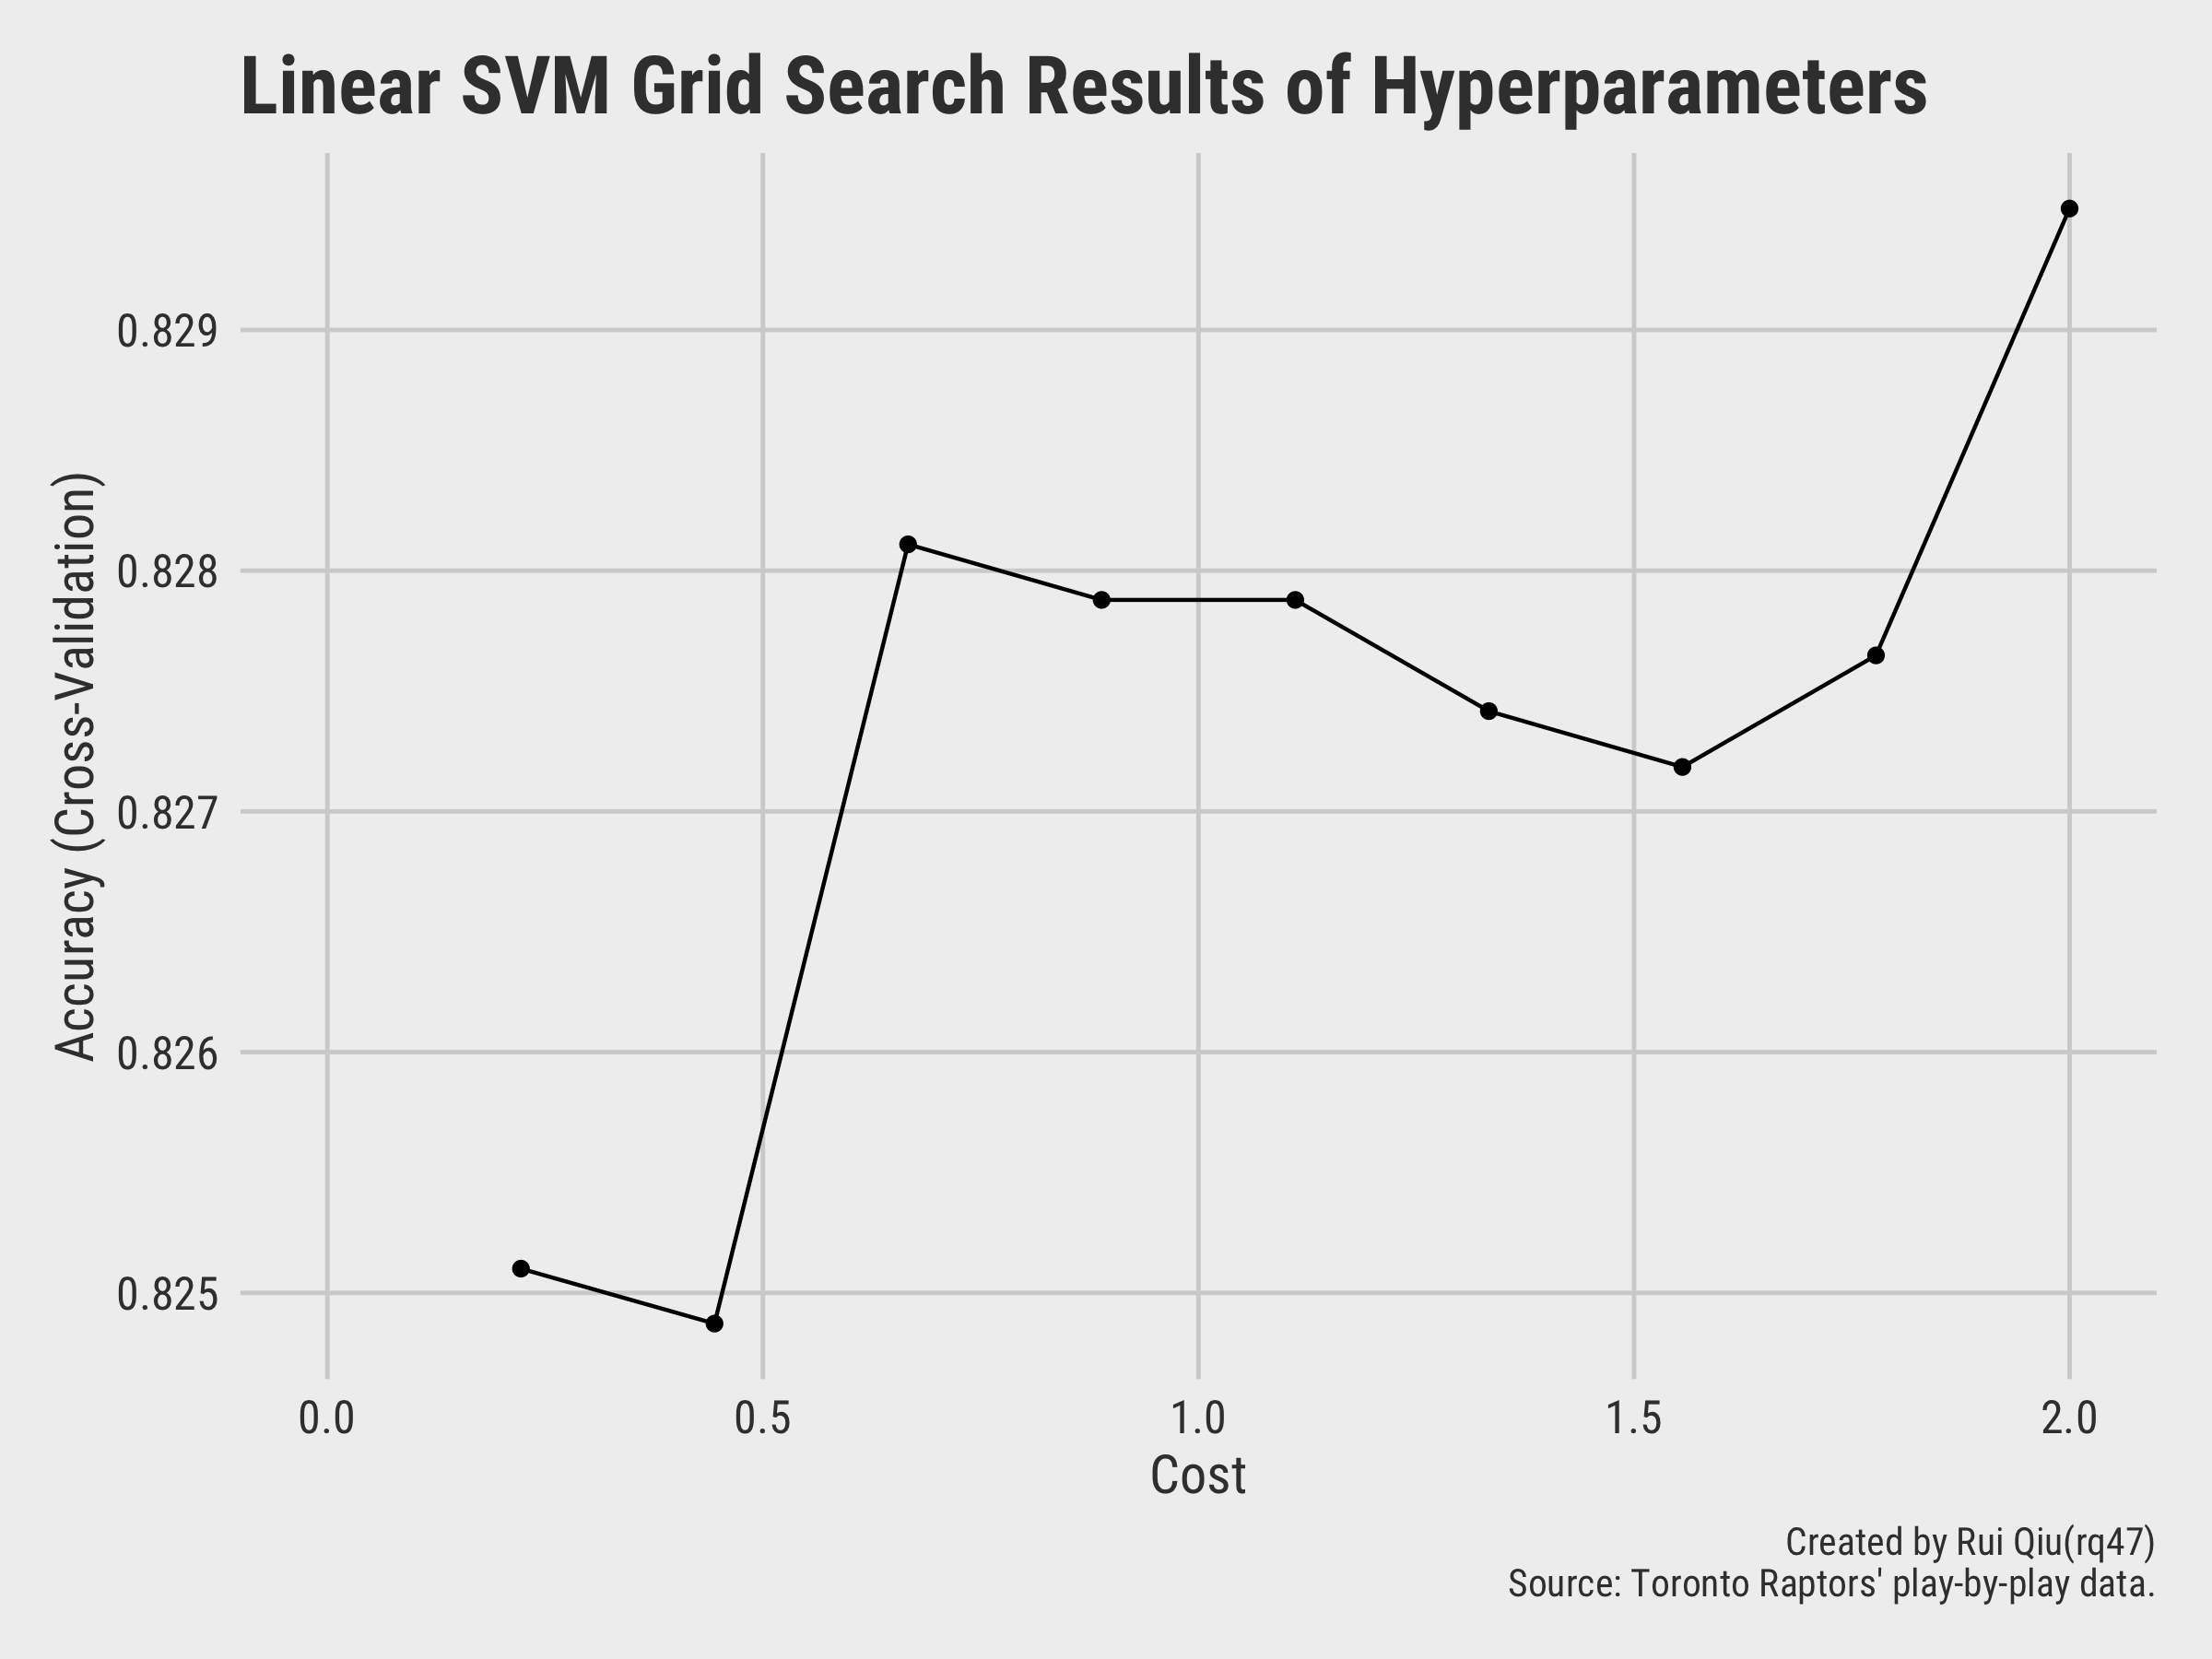
The model with C=2 seems to returns the highest accuracy. The detailed
list of
metrics of different model tested with a linear kernel is shown below:
The confusion matrix of selected linear SVM model on testing data is given by:

The accuracy is 83.12%.
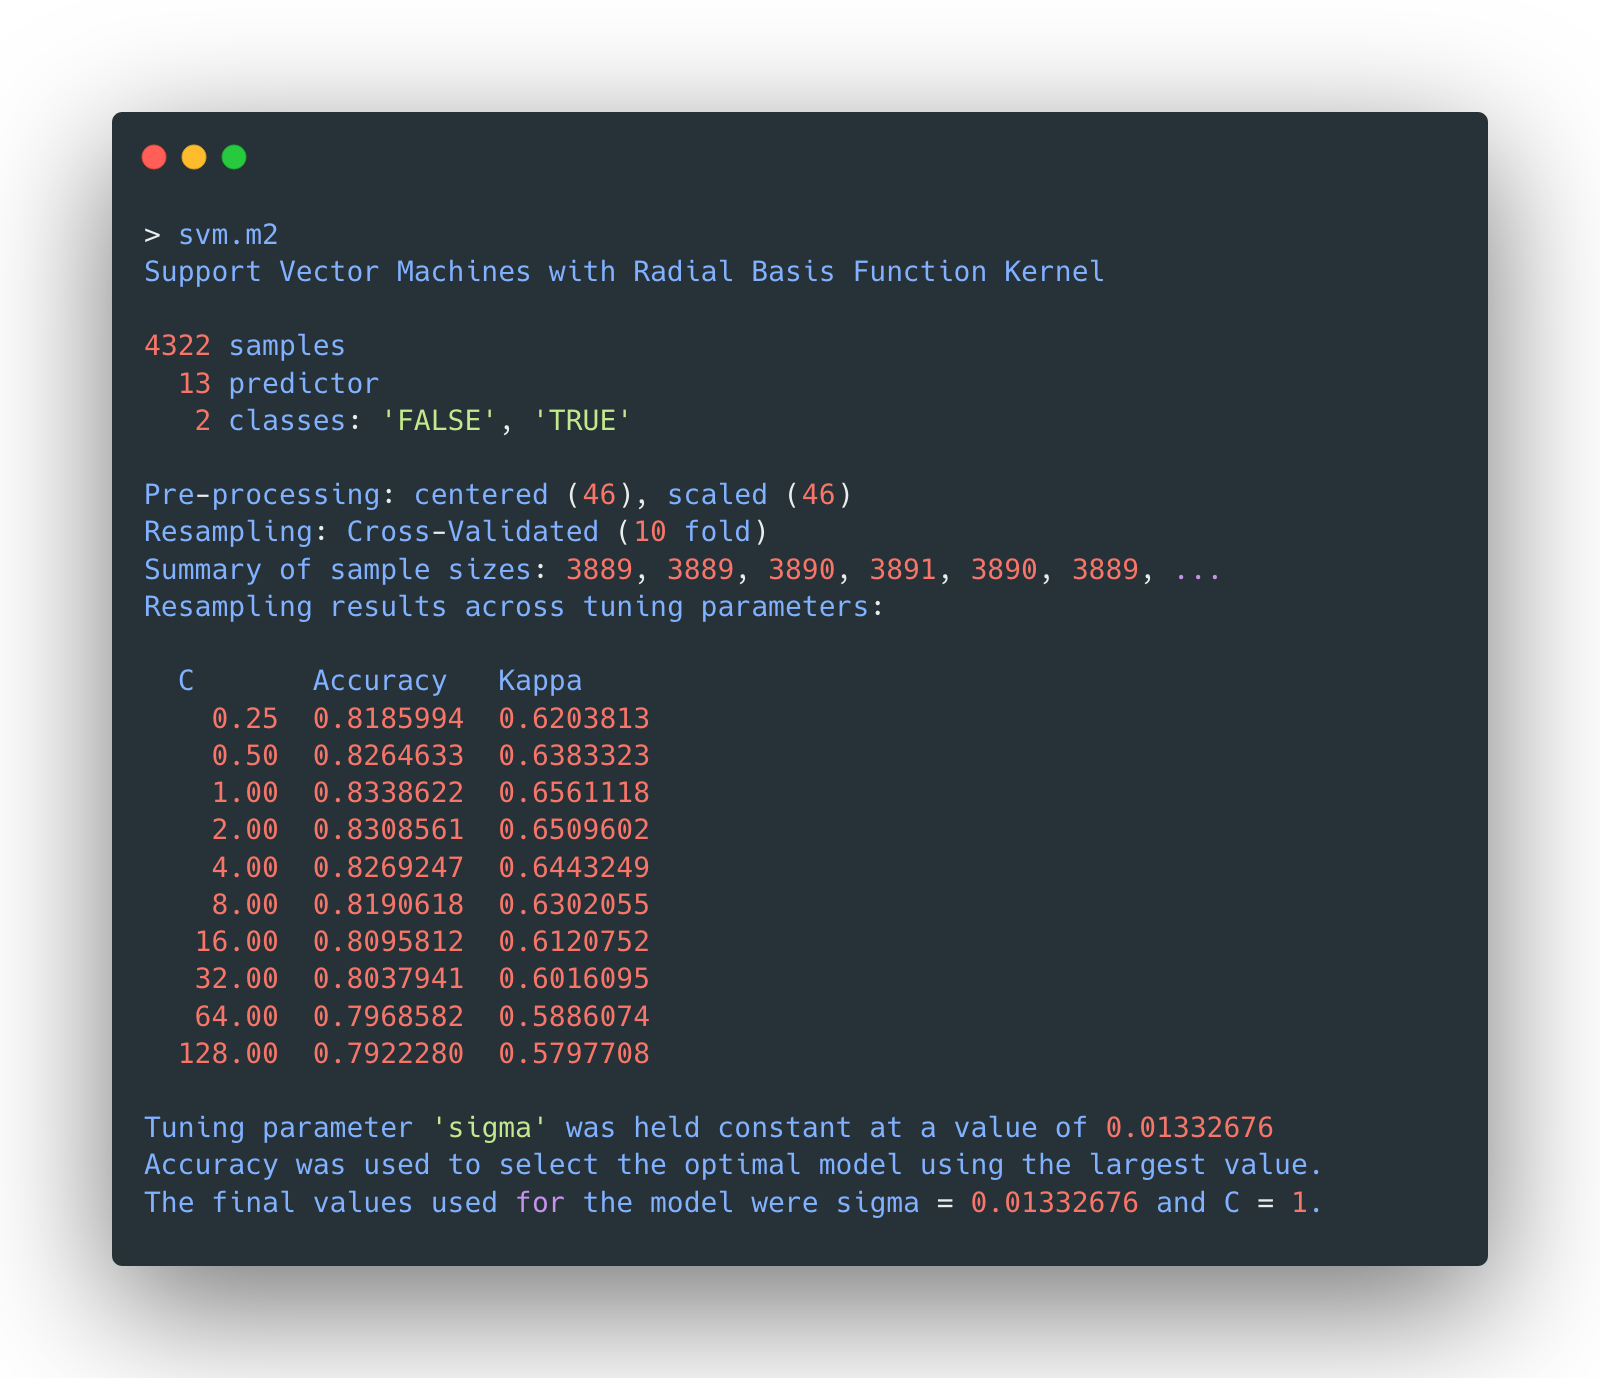
Model 2 - RBF kernel tuning
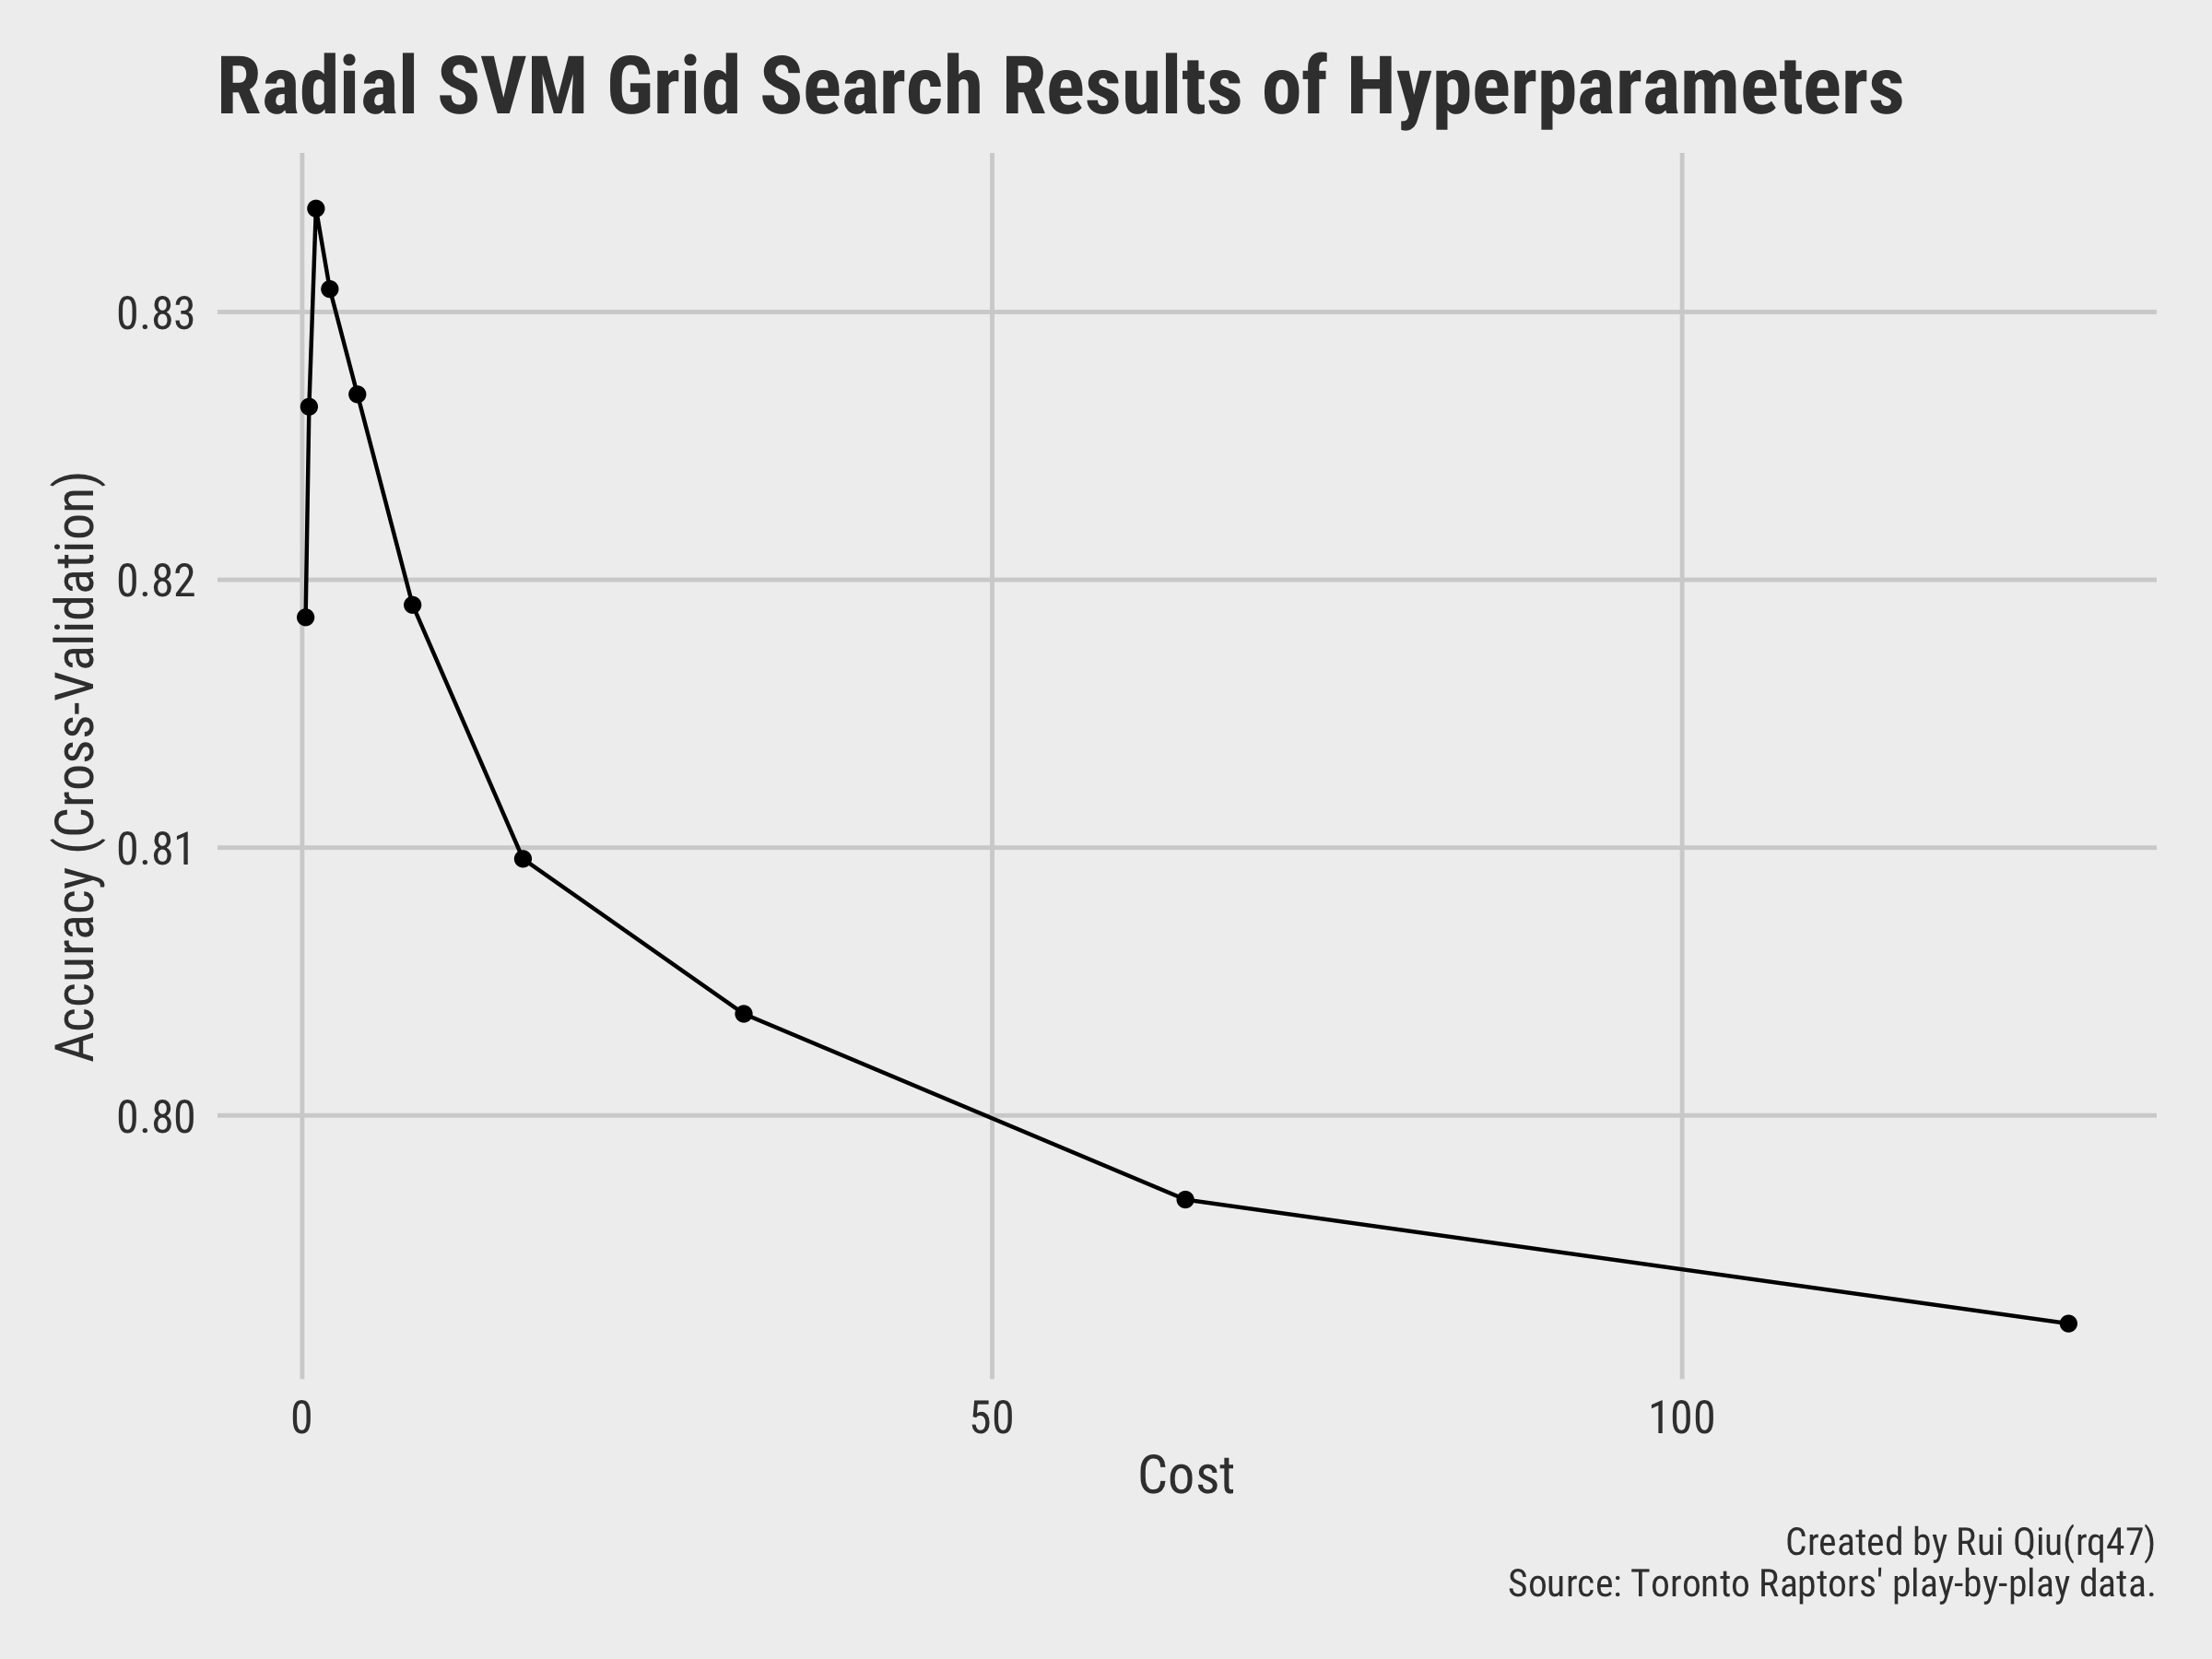
The model with C=1 and sigma=0.0133 seems to
returns
the highest accuracy. The detailed list of metrics of different model tested with a RBF kernel is
shown
below:
The confusion matrix of selected RBF kernel SVM model on testing data is given by:
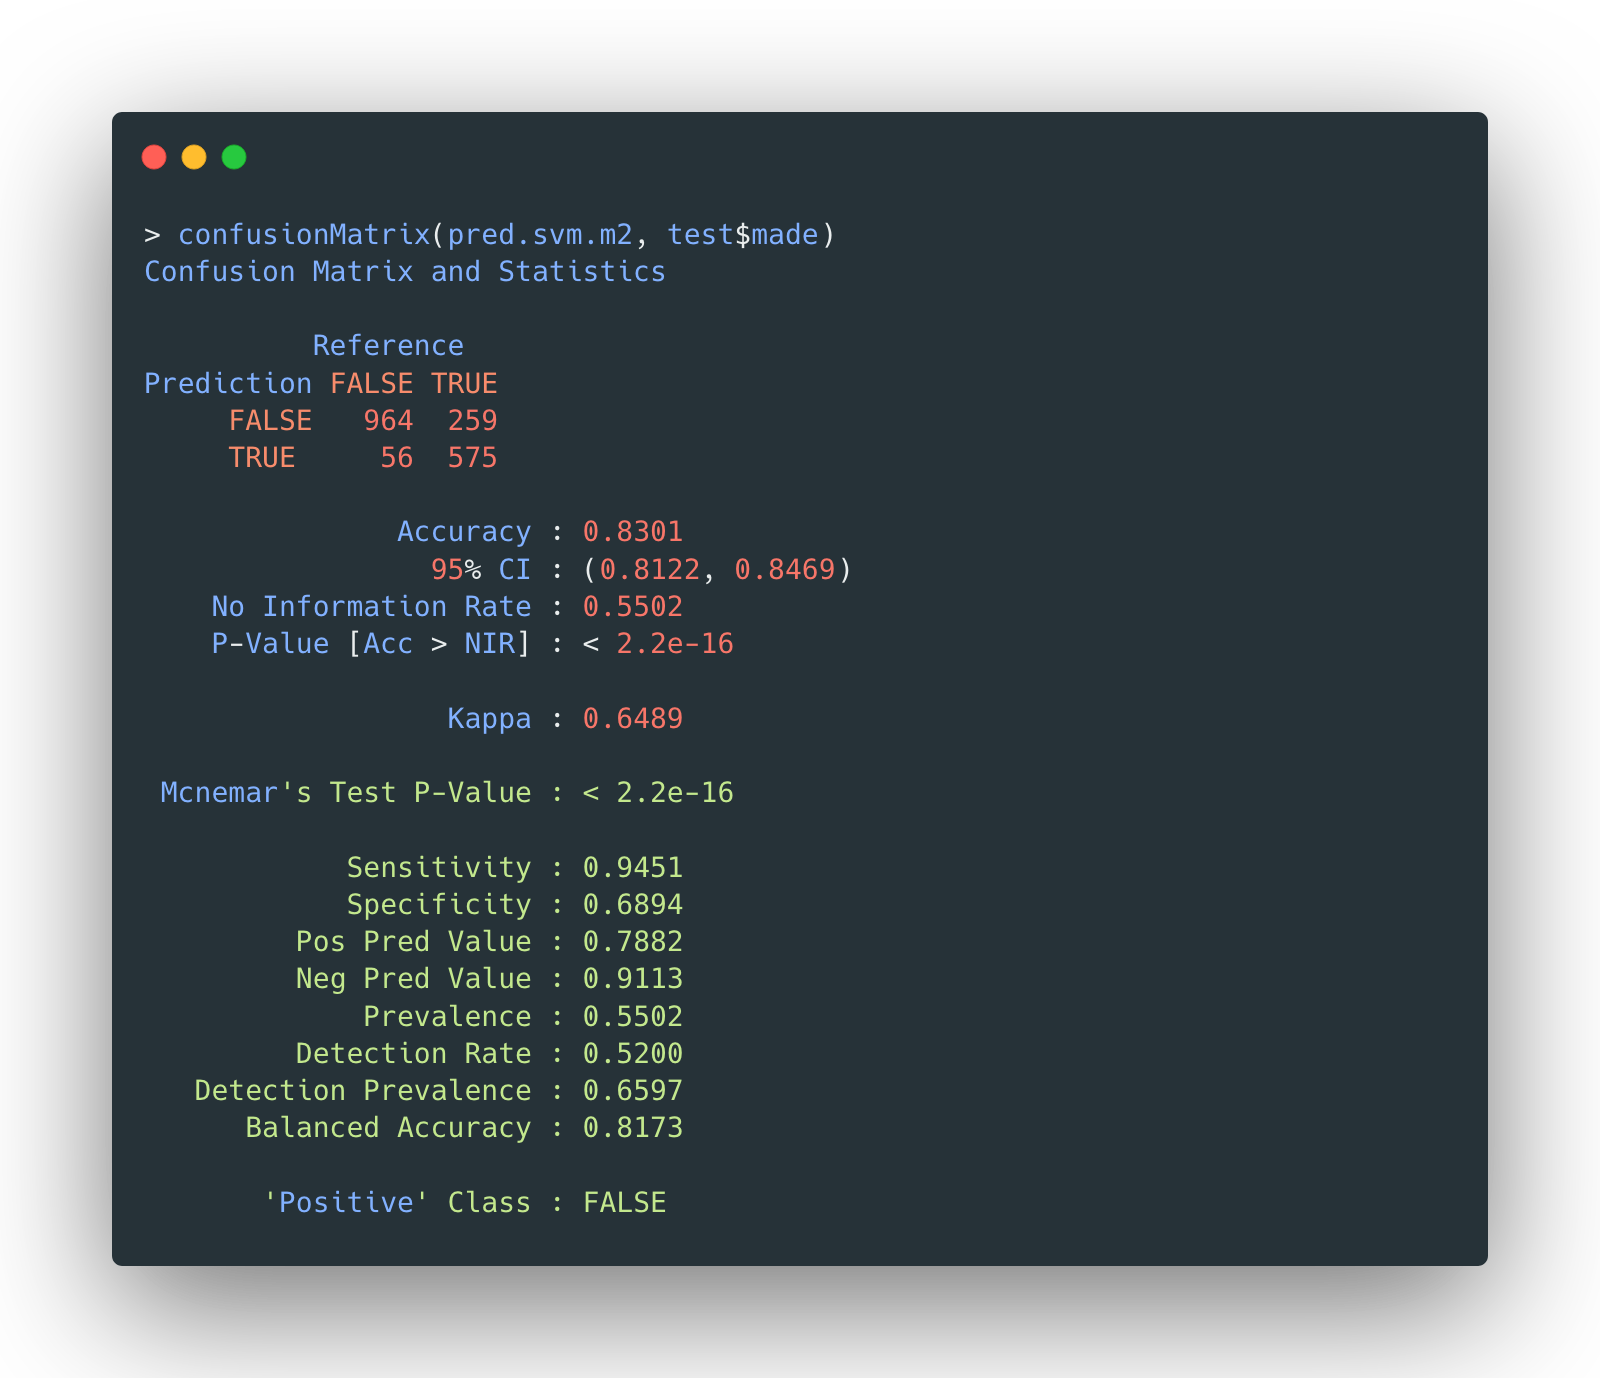
The accuracy is 83.01%, slightly lower than linear SVM’s.
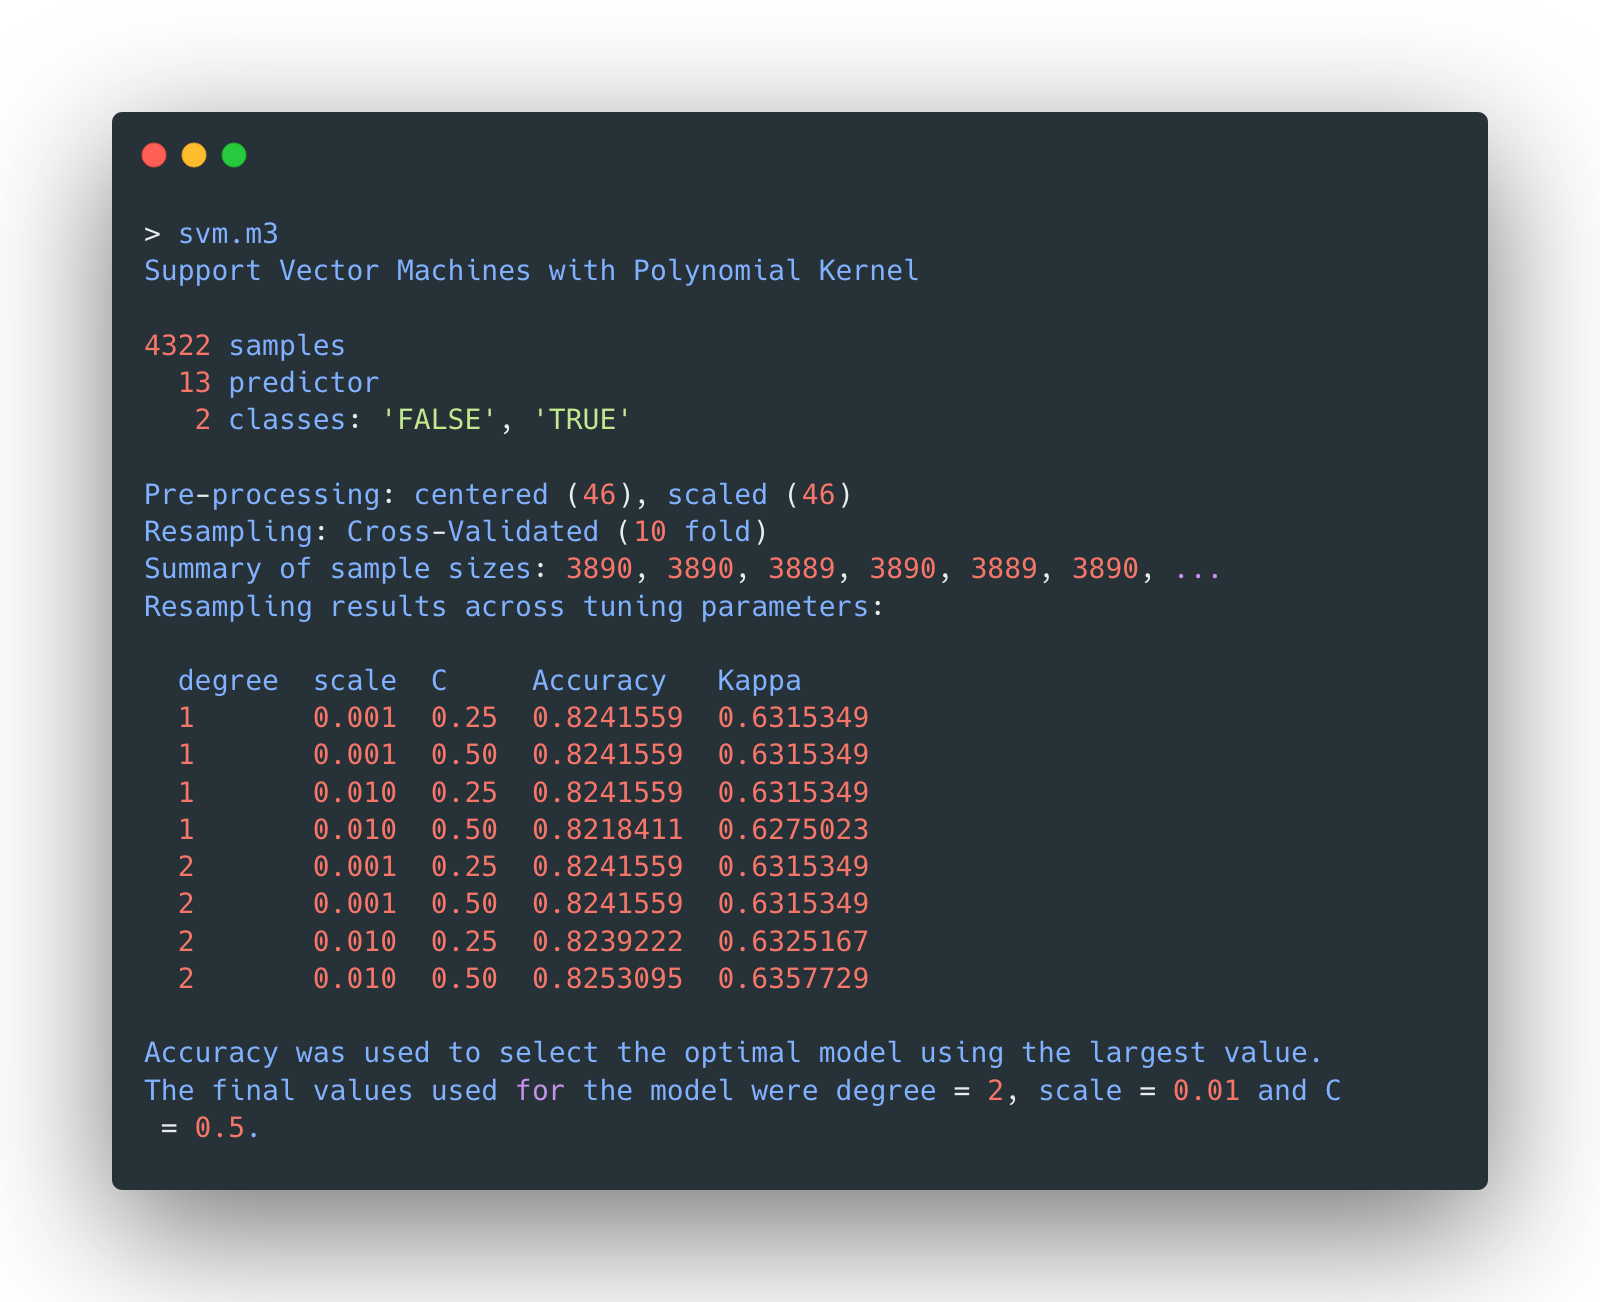
Model 3 - polynomial kernel tuning
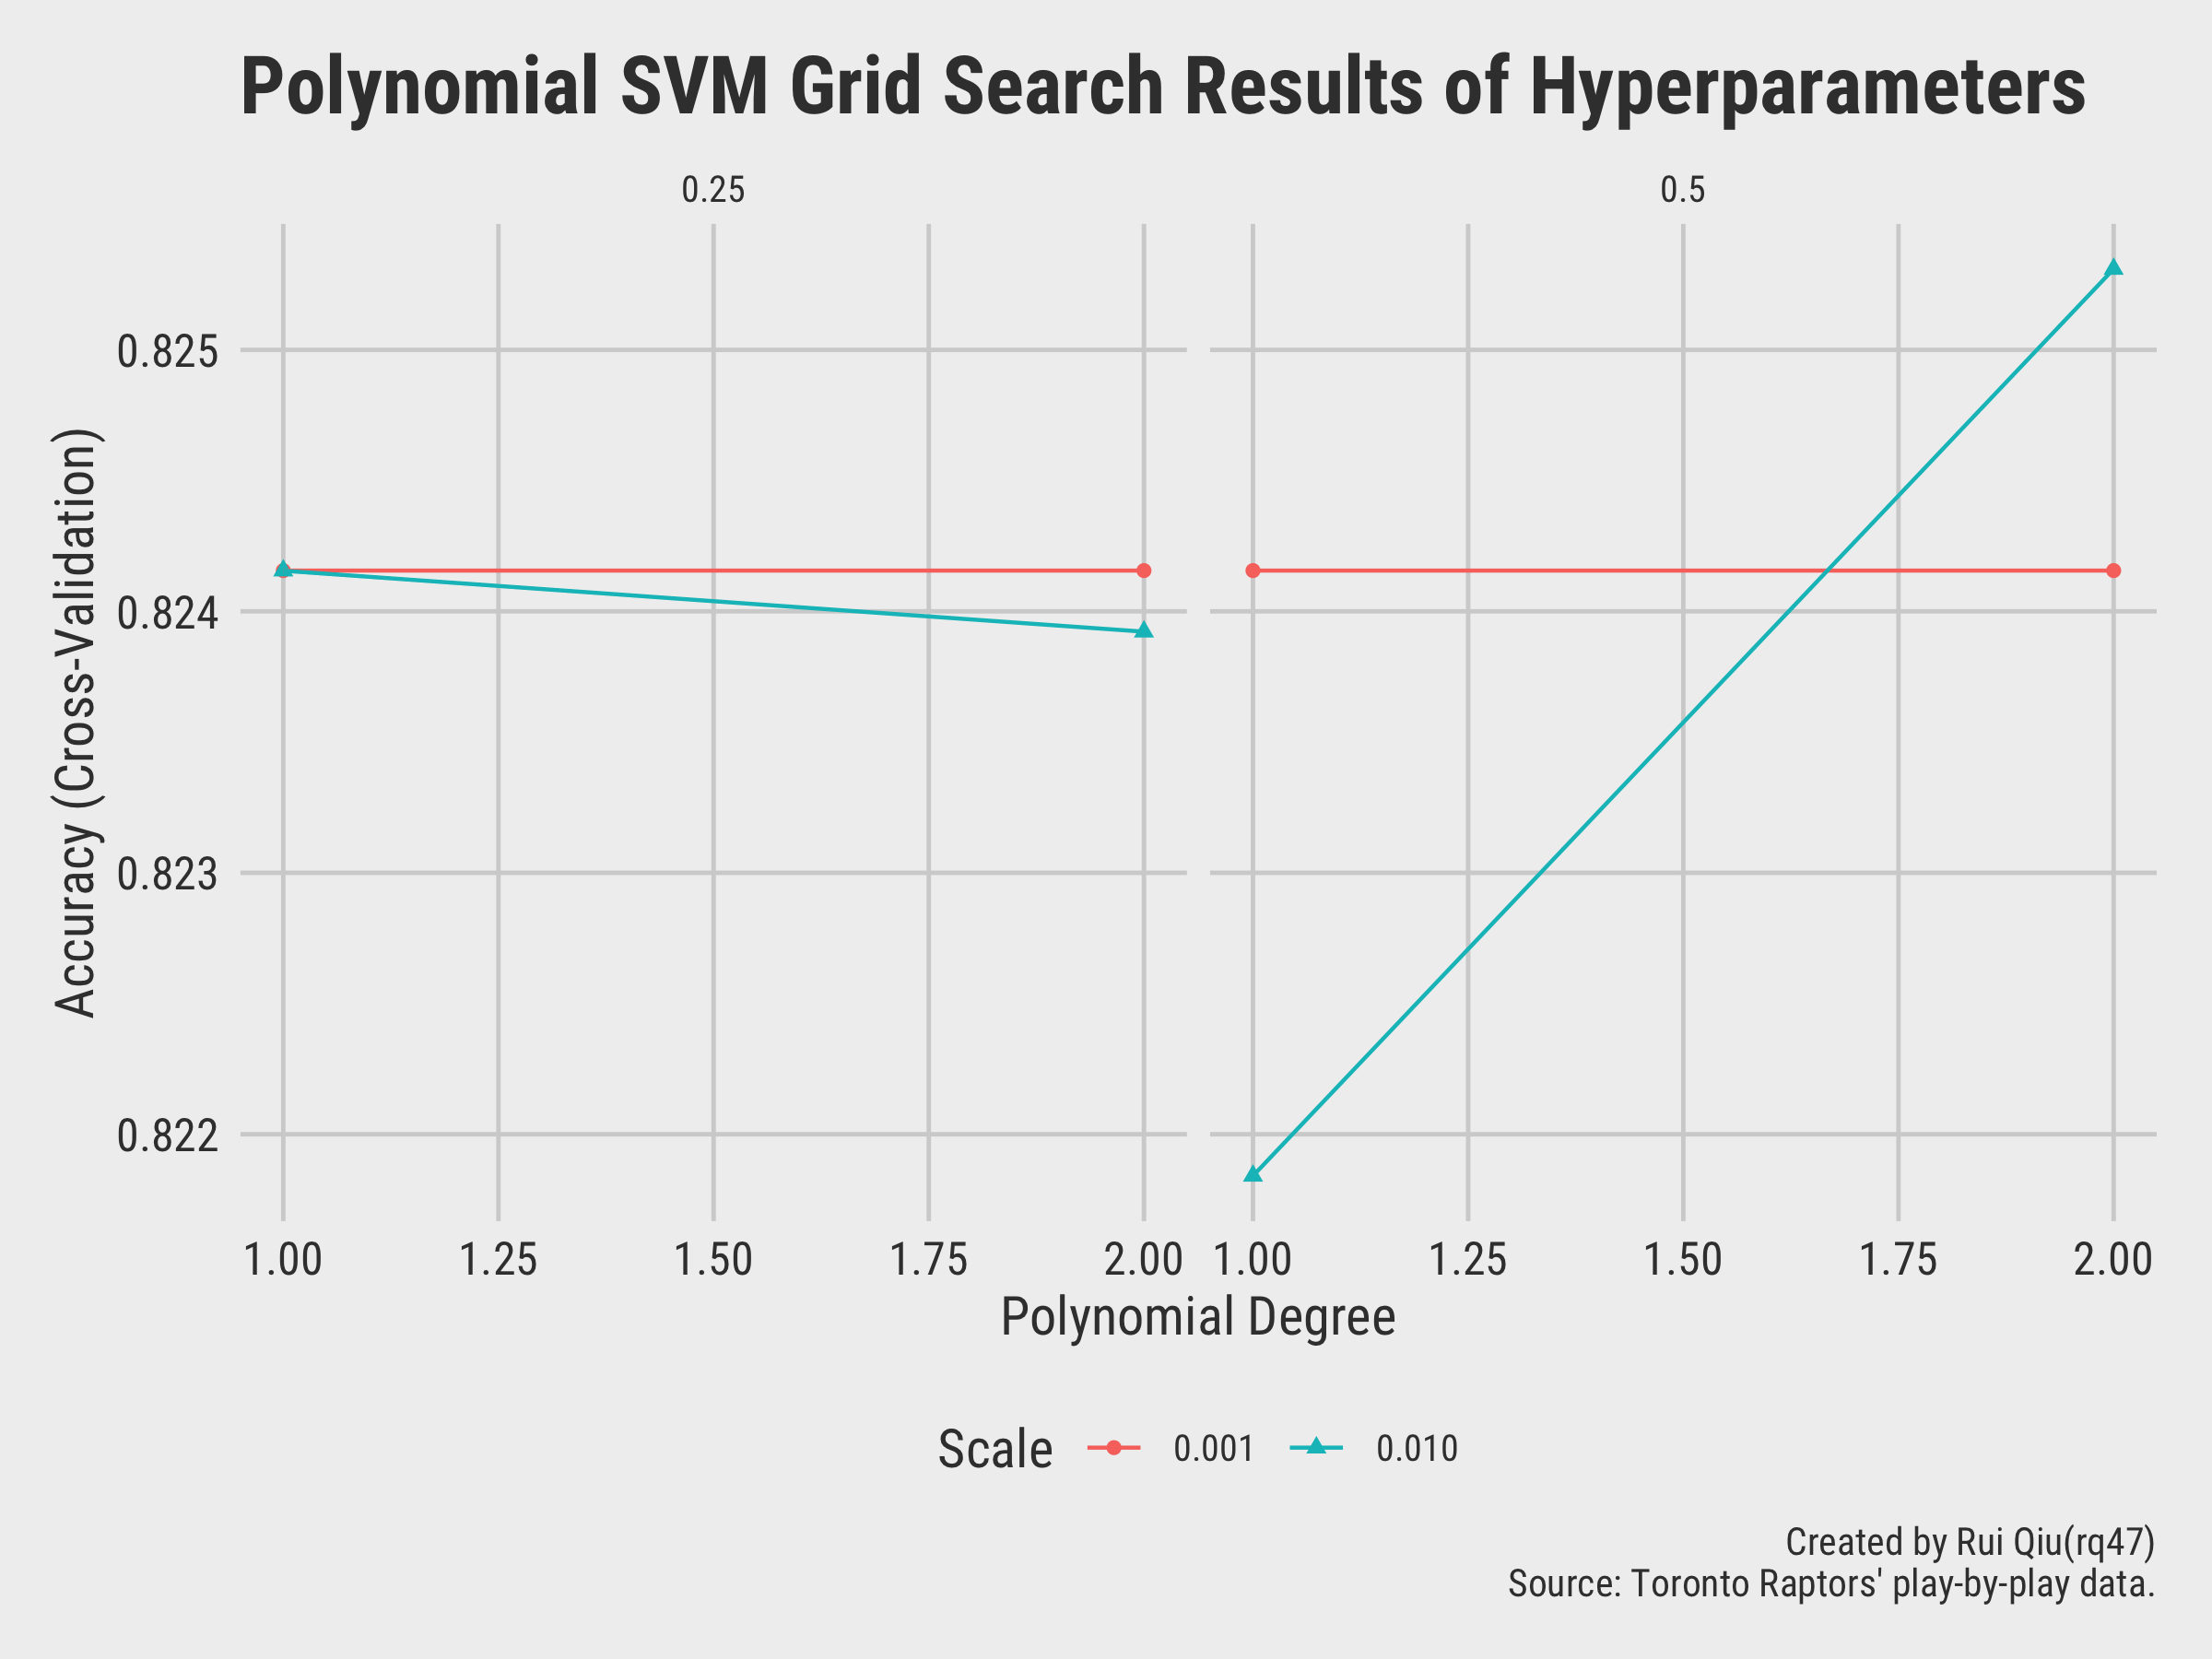
The model with degree=2, scale=0.01, and
C=0.5 seems to returns the highest accuracy. The detailed list of metrics of
different
model tested with a polynomial kernel is shown below:
The confusion matrix of selected polynomial-kernel SVM model on testing data is given by:
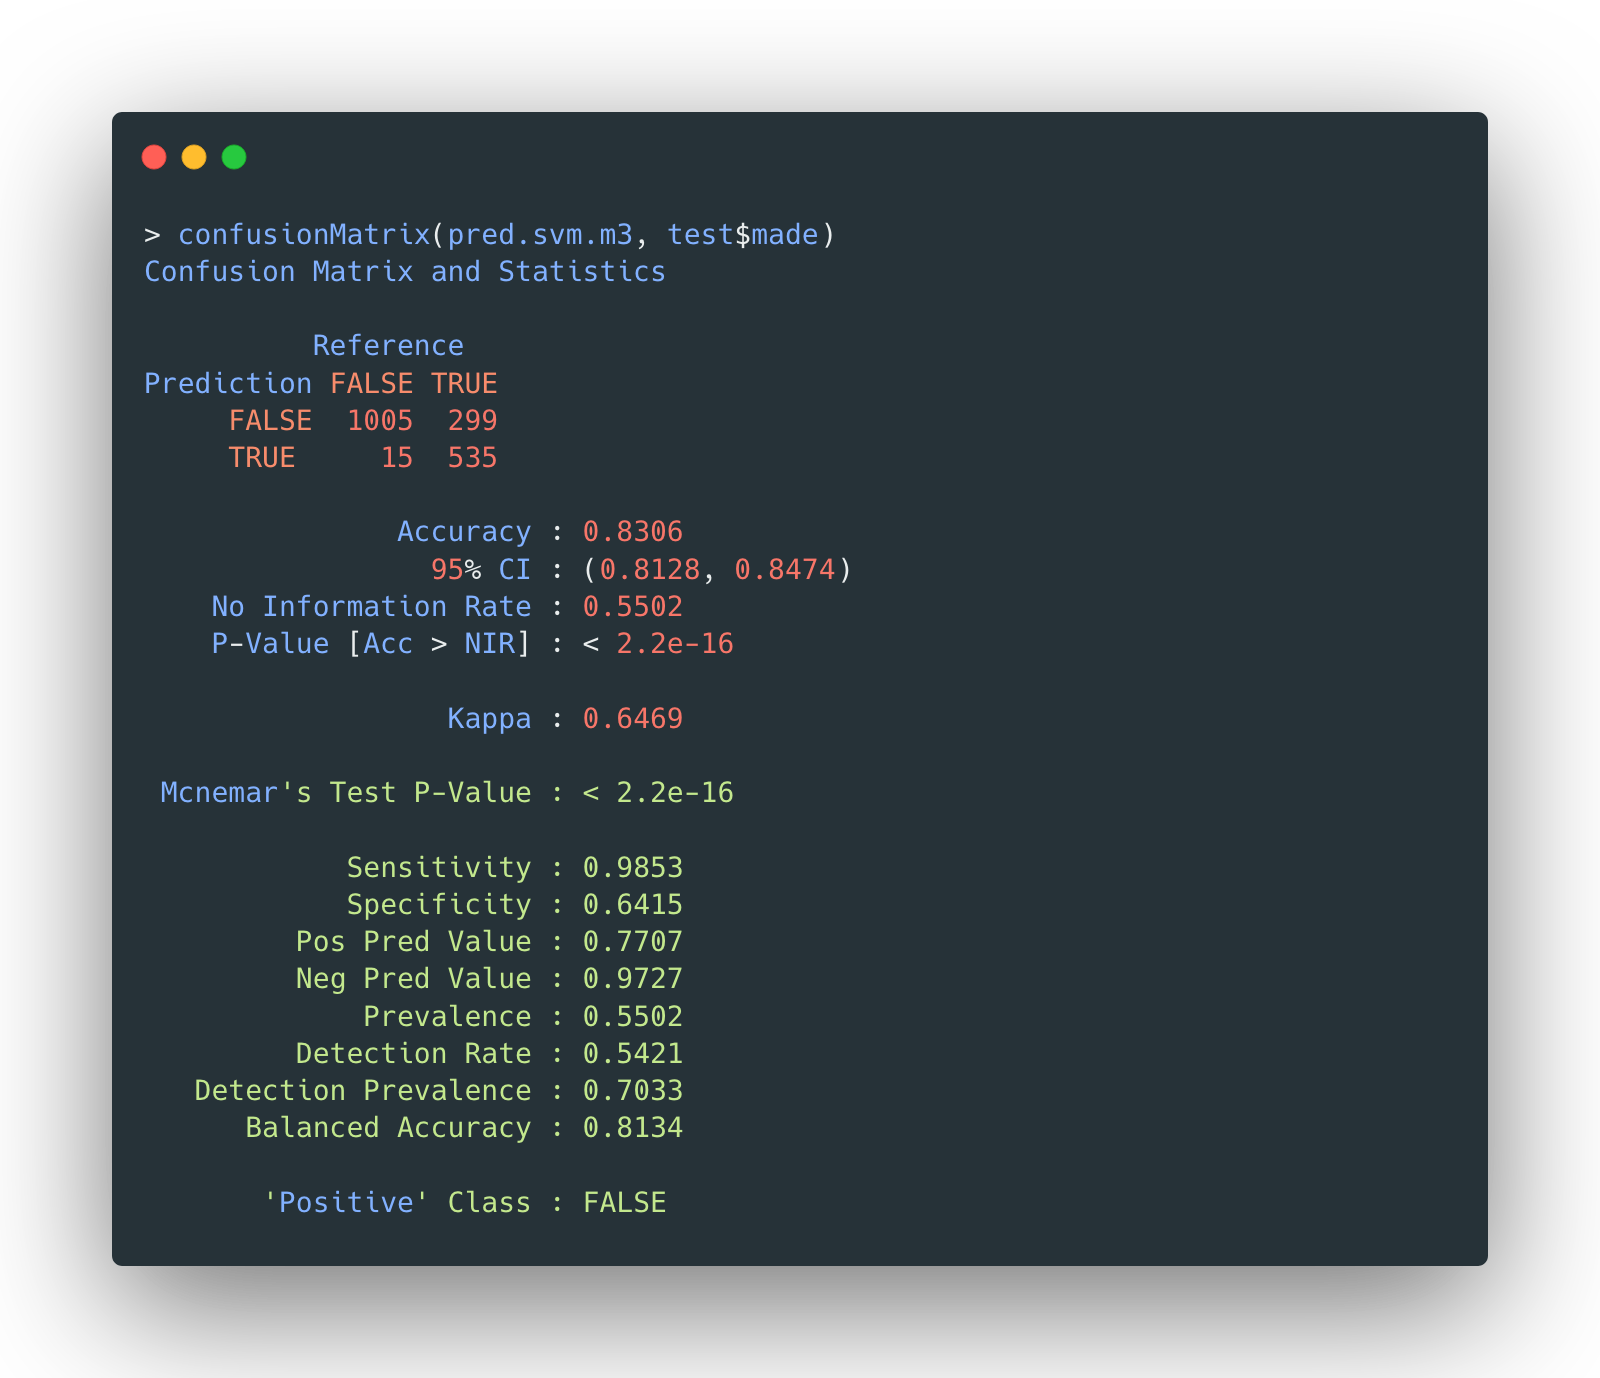
The accuracy is 83.06%. It seems that blindly increasing the complexity of the model does not improve the accuracy.
Comparison
It’s not hard to see these three SVM models are not dramatically in terms of accuracy. Nonetheless, if only one model needs to be picked in the end, the linear SVM with the best performance will be the one, both because of its accuracy and its relative simplicity.
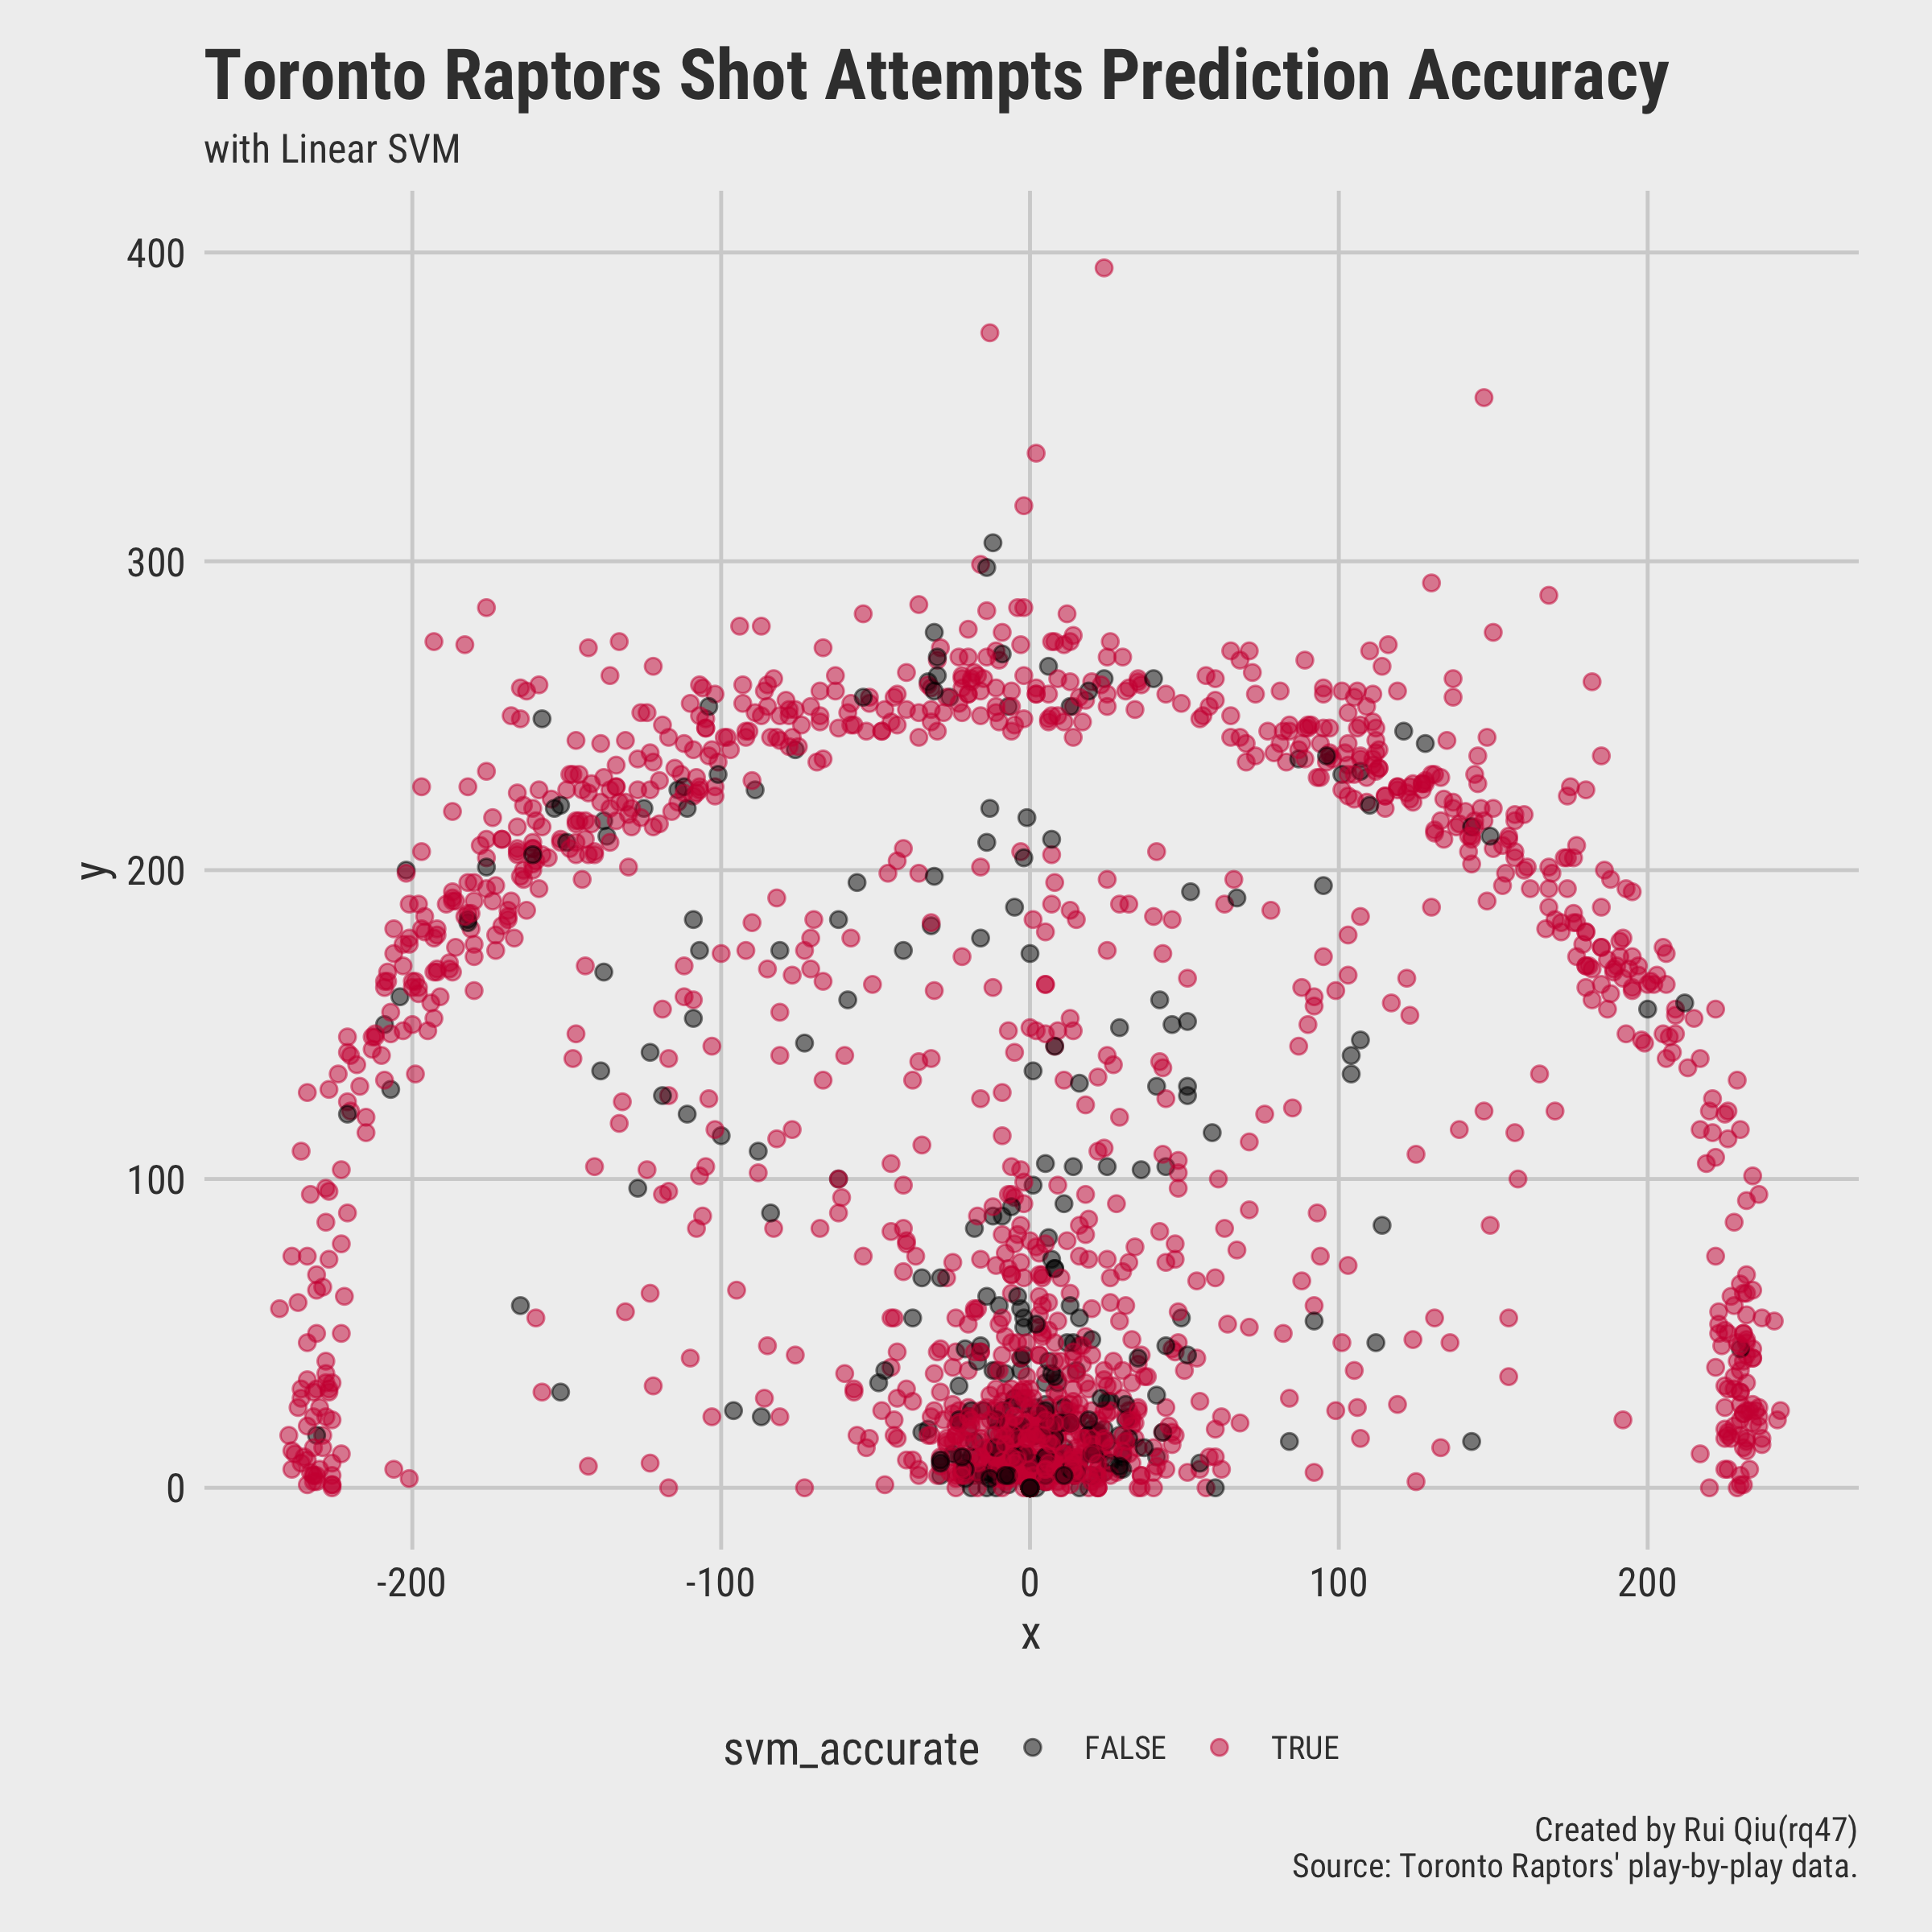
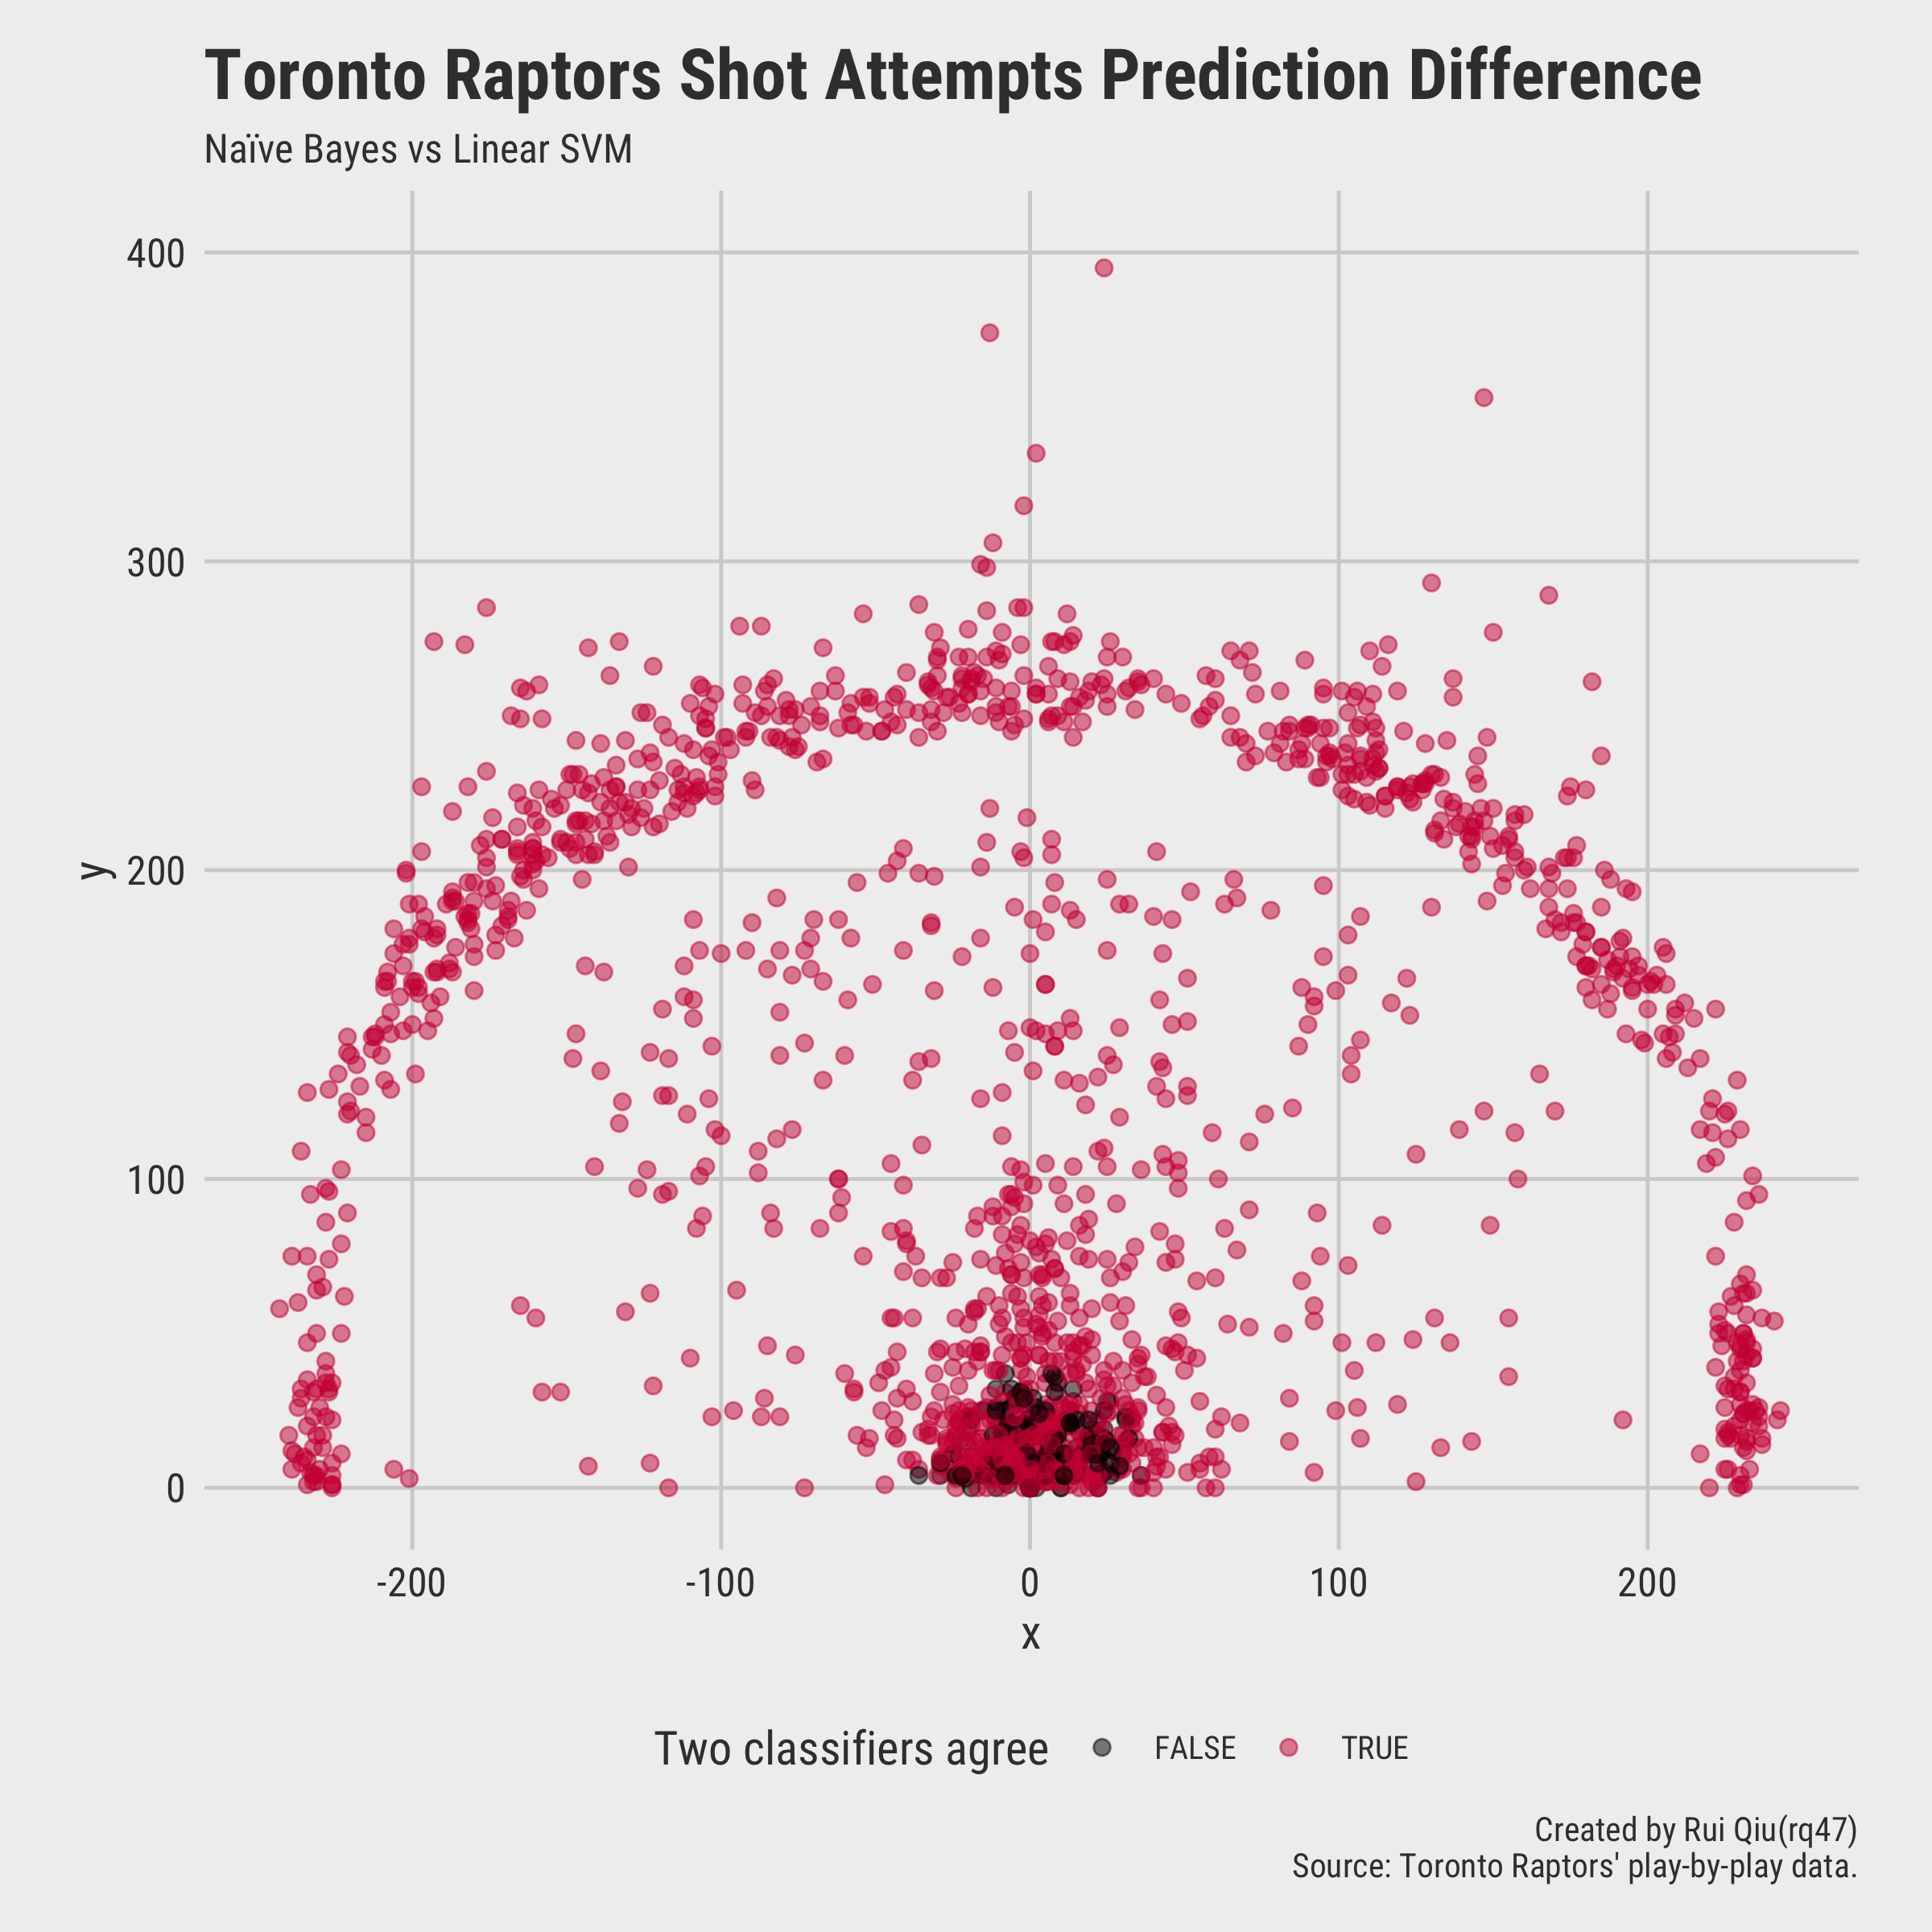
A visualization of predicted shot attempts versus the actual shot attempts is plotted below:
Additionally, the prediction done by linear SVM can be compared with naïve Bayes prediction in parallel.
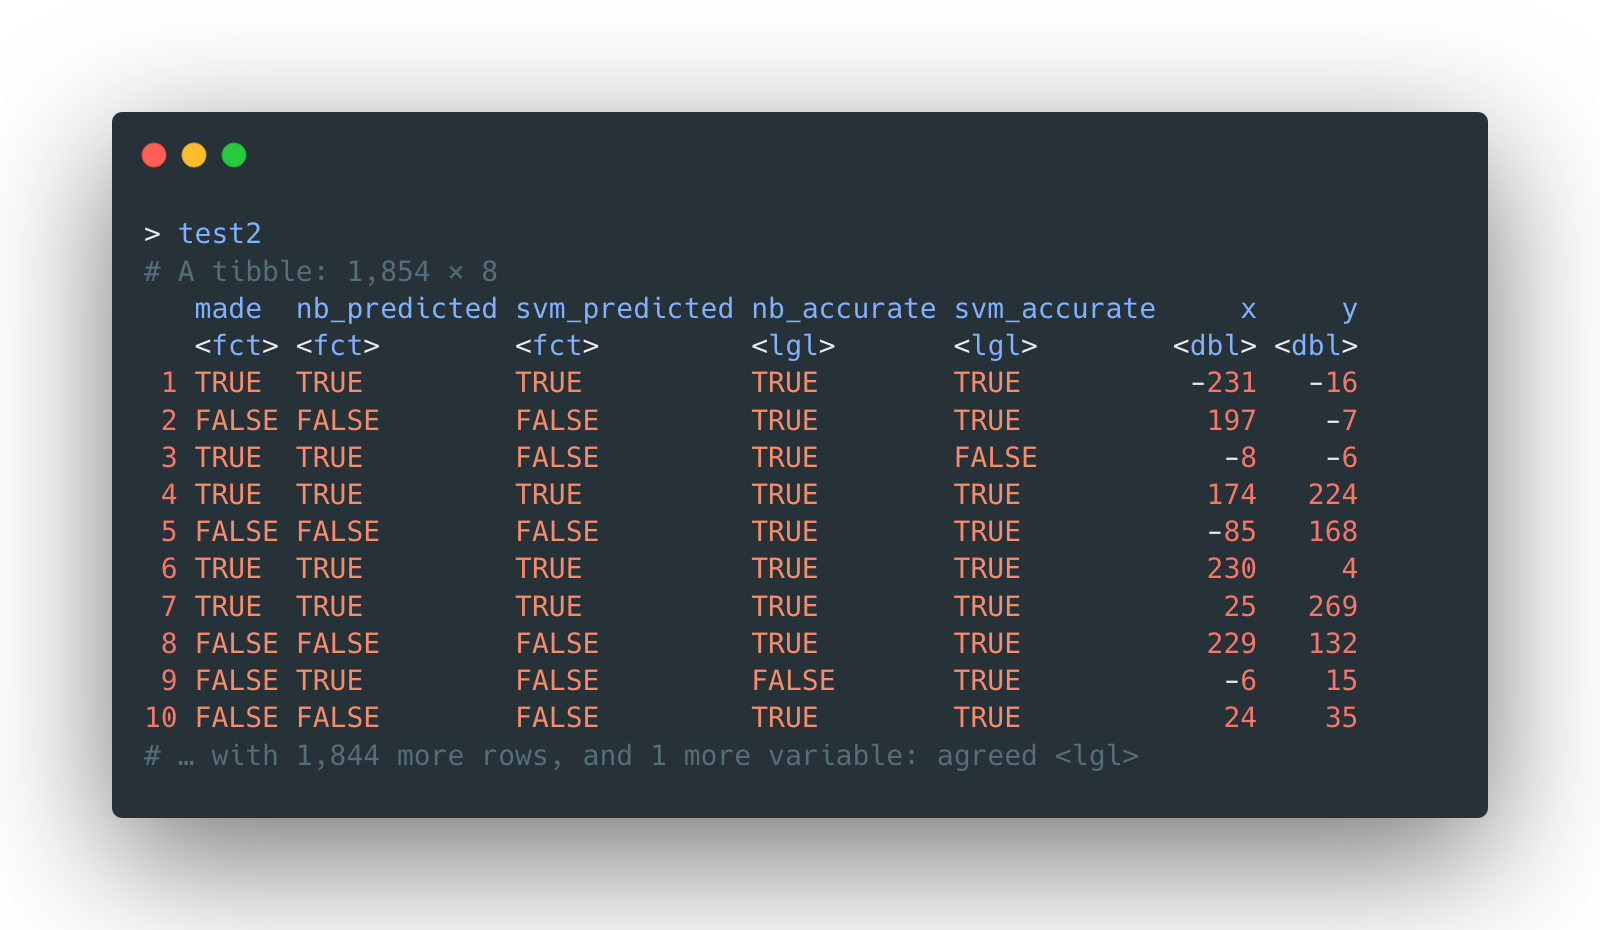
A quick look at the comparison would reveal that both classifiers agree on most of the predictions.
Interpretation
This is the tricky part of a support vector machine. The SVM usually remains hard to explain as it draws decision boundaries repeatedly to separate data points in more (and high) dimensions.
For this selected linear SVM, however, it actually has a useful interpretation:
- The result of a linear SVM is a hyperplane, also refers as the decision boundary that separates the predicted classes as best as possible. The weights of a hyperplane can be considered as the coefficients of linear equation (but in a higher dimension). Such weights form a vector.
- The direction of the vector does the prediction. What it does is it takes all the features of a record into account, then calculates the dot product with the vector. The result will be either positive or negative, which essentially indicates the which side the predicted value is on.
Back to the shot attempts of Toronto Raptors, the linear SVM finds the most suitable hyperplane to
cut
through data points in high dimension once and for all. It is definitely not relying on the
coordinates
x and y, otherwise a clear straight line decision
boundary
would appear in the court visualization above. It’s usually not an ideal case to visualize a
decision boundary
even with a linear SVM as a precondition as the categorical variables prevent the visualization to
be
human-understandable.
Text data with Python
Data and scripts
Data
- Script: reddit-nb-svm.ipynb
Just like the record data, the text data in this section is also from the tree-based classification chapter.
The data is preprocessed by removing stopwords, conversion to lower case, and then calculated as Tf-idf. What is different from last time is that the texts are not stripped as bigrams but unigrams this time.
Additionally, the target variable upvote_ratio is replaced by
popularity, a categorical variable indicating how popular the thread is within
the
time span of a year. To make the classes more balanced, the variable
popularity is
trivially set as either Extremely Popular (top 50) or
Very Popular (top 51-100).
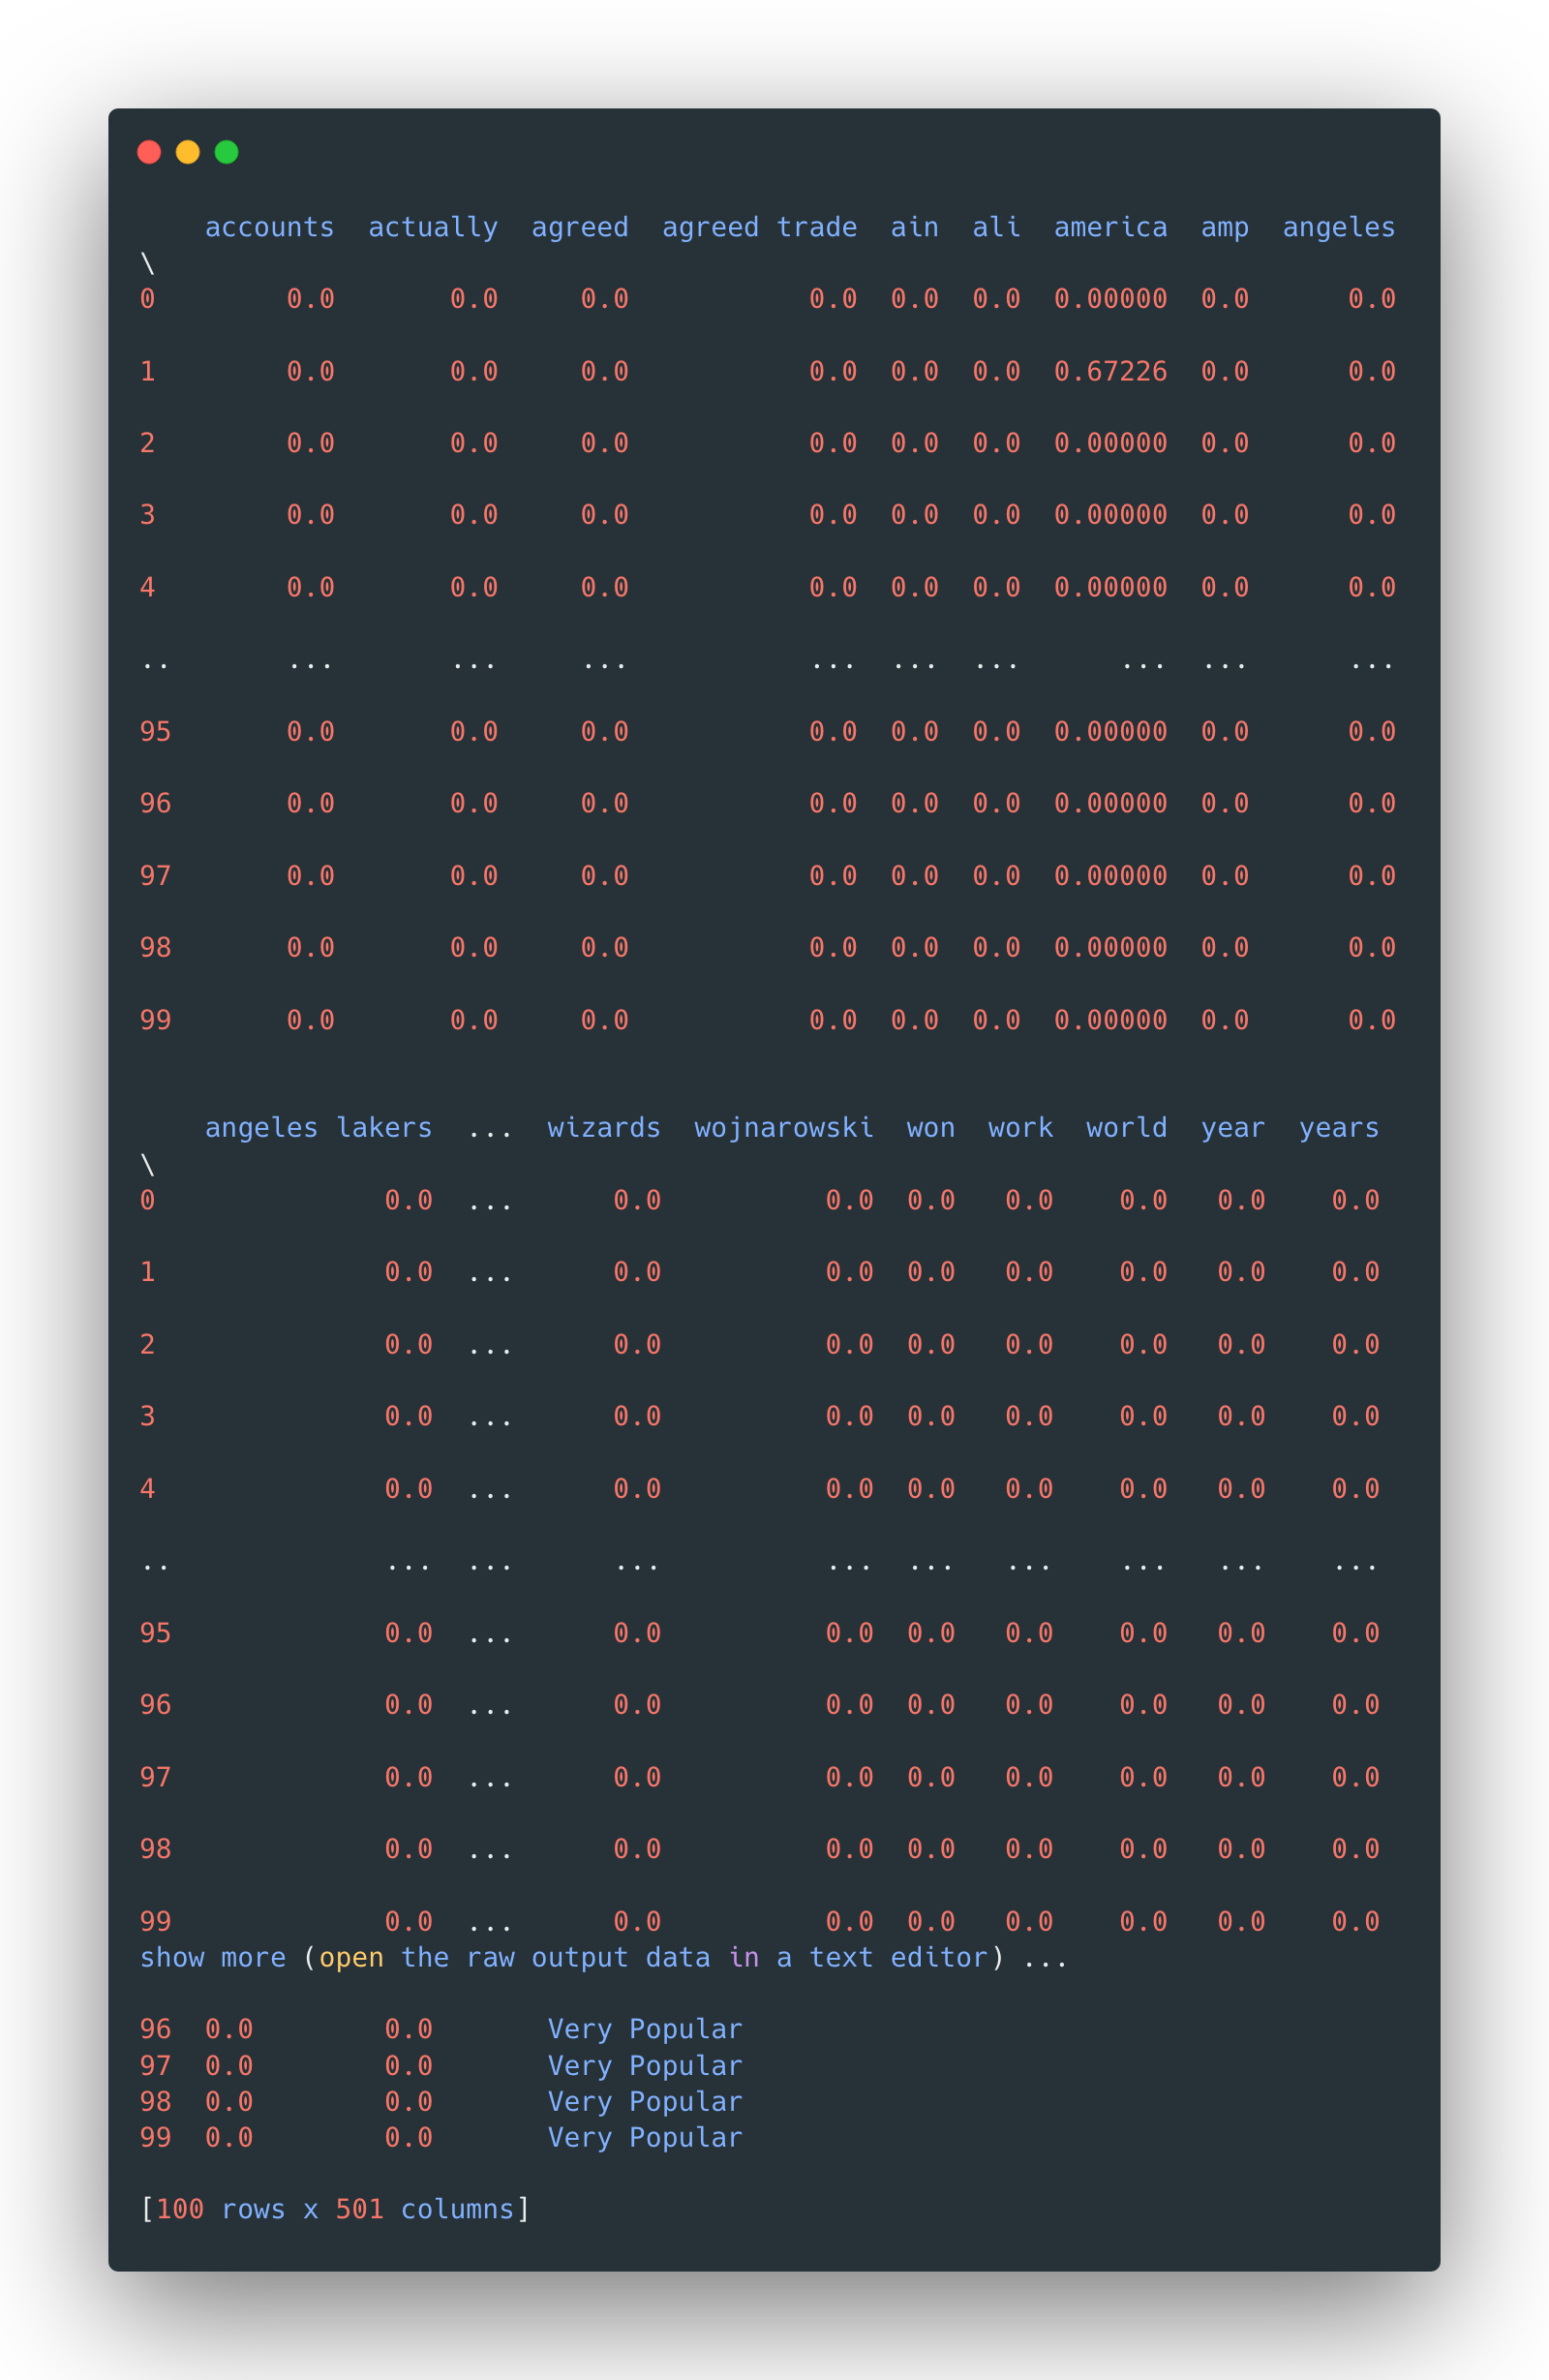
The tf-idf values are also standardized, although the matrix is still very sparse due to the nature of text data that not too many words are repeated in each document.
The general structure of the preprocessed data looks like this:
Again, the text data is split into a pair of 80-20 training/testing sets.
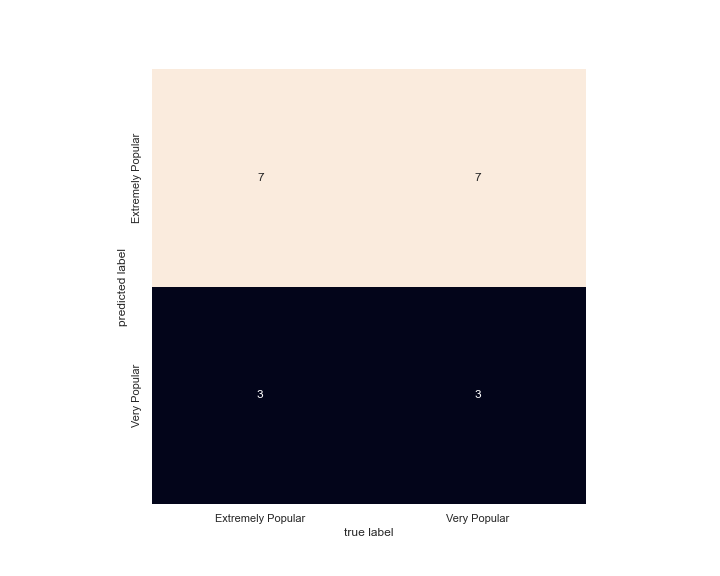
Linear kernel
The SVM model with linear kernel is tested for a range of different cost parameters, from 0.01 to 100.
The accuracies of these five models are:
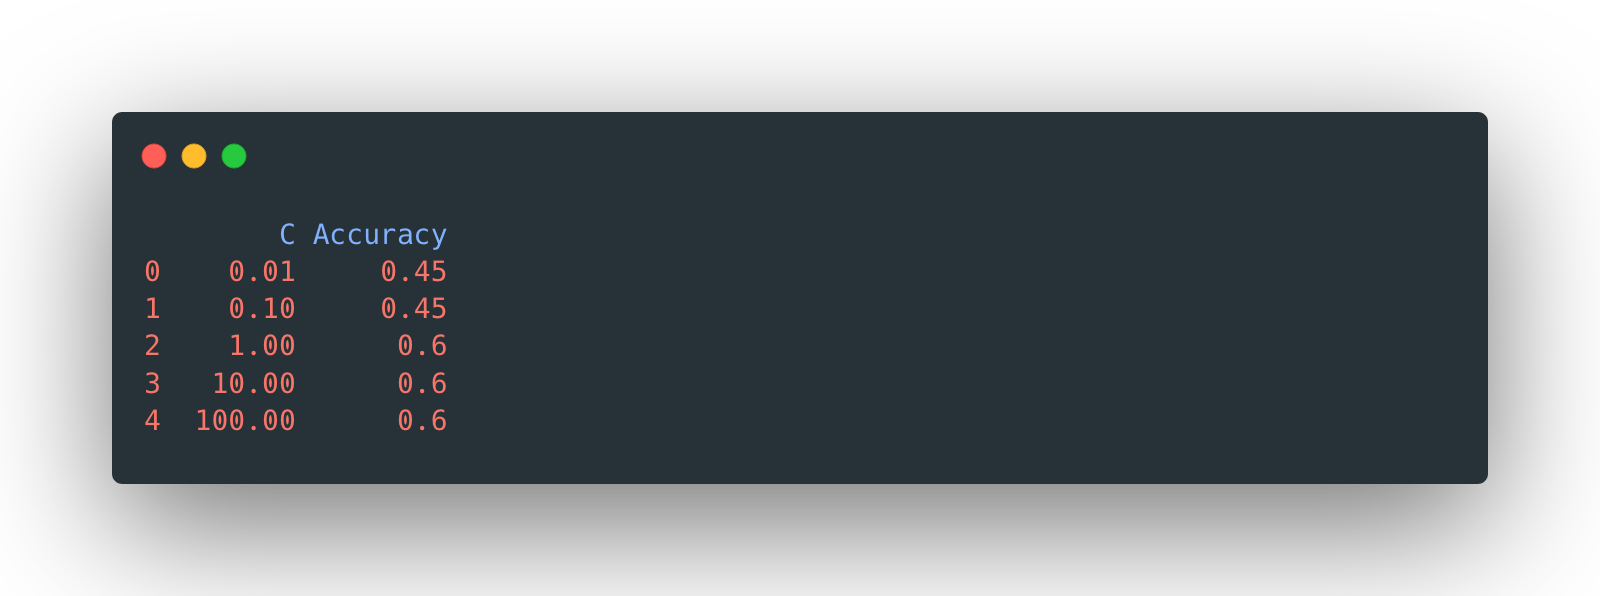
Since C=1 has the highest accuracy and it’s the relatively simple one, it
is
selected as the final predictive model. Then the test data is fitted with this model.
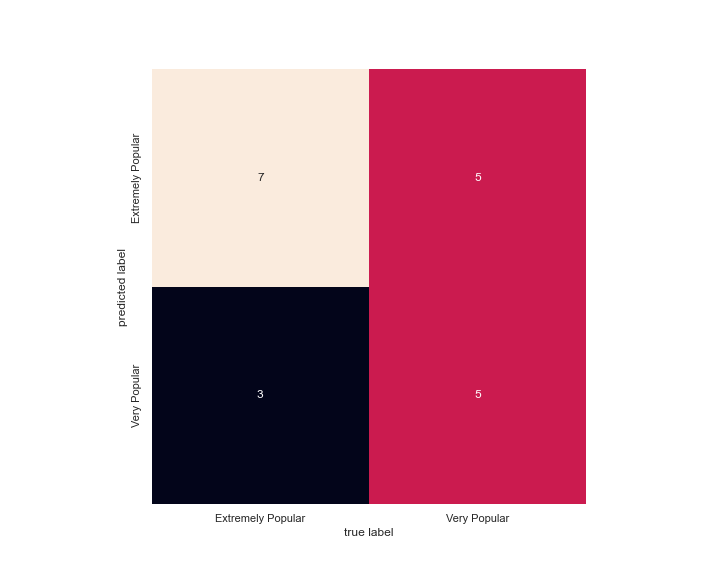
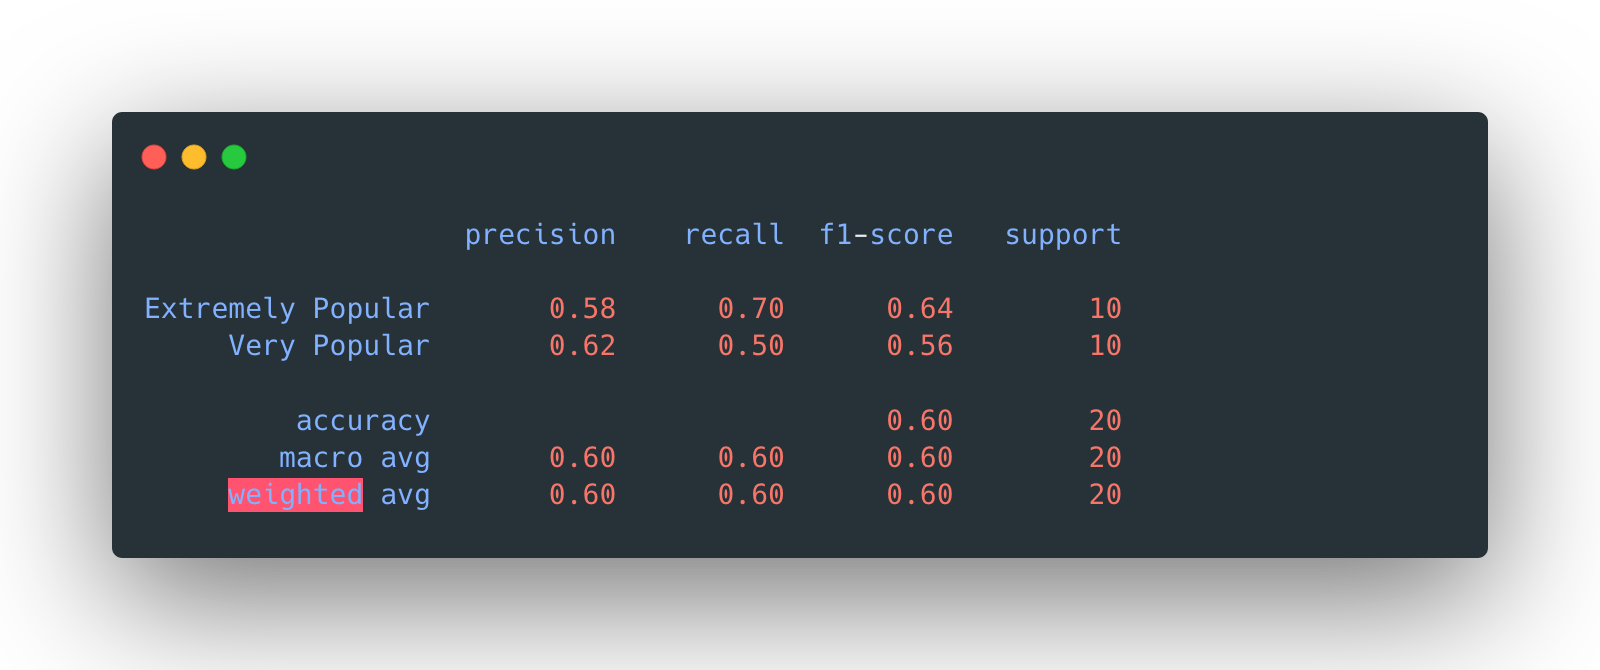
The overall accuracy is again, 60%.
Polynomial kernel
The SVM model with polynomial kernel is tested for a range of different degrees, from 1 to 6.
The accuracies of these six models are:
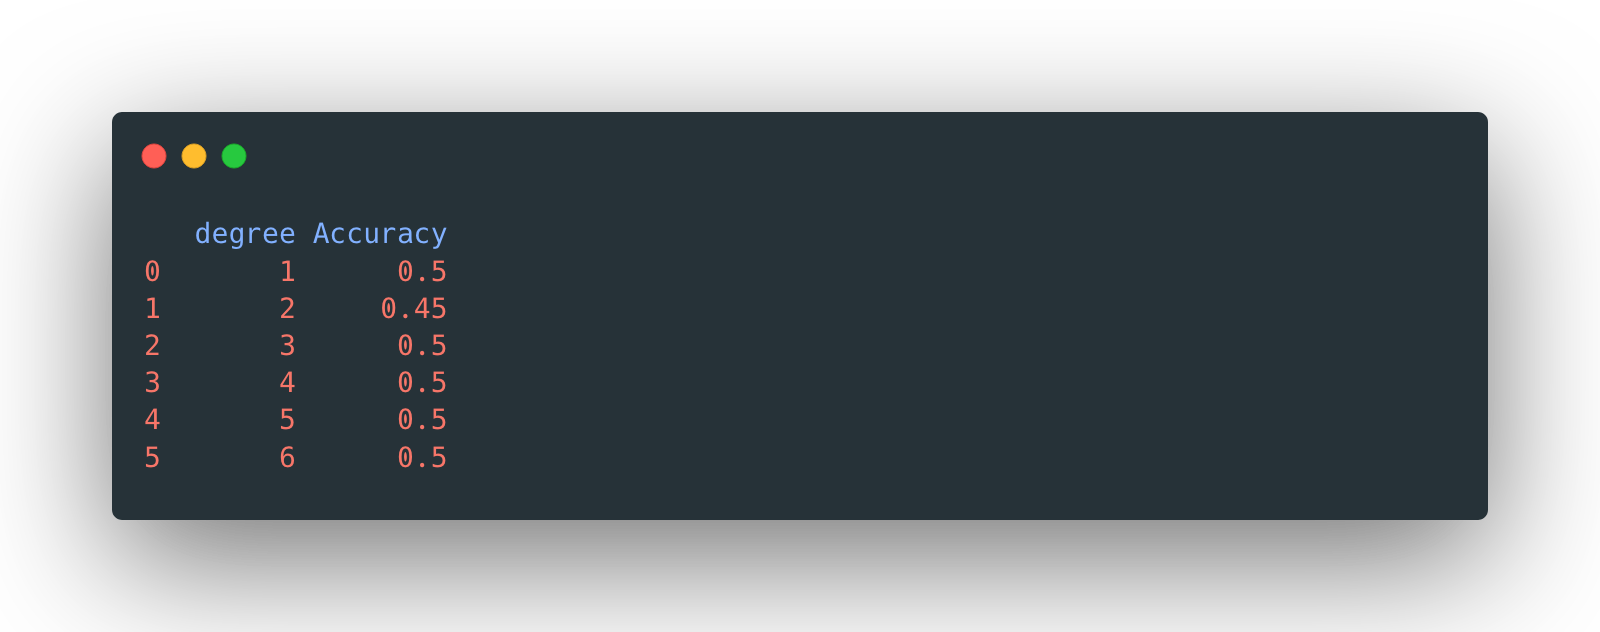
Since degree=1 has the highest accuracy and it’s the relatively simple
one, it
is selected as the final predictive model. Then the test data is fitted with this model.

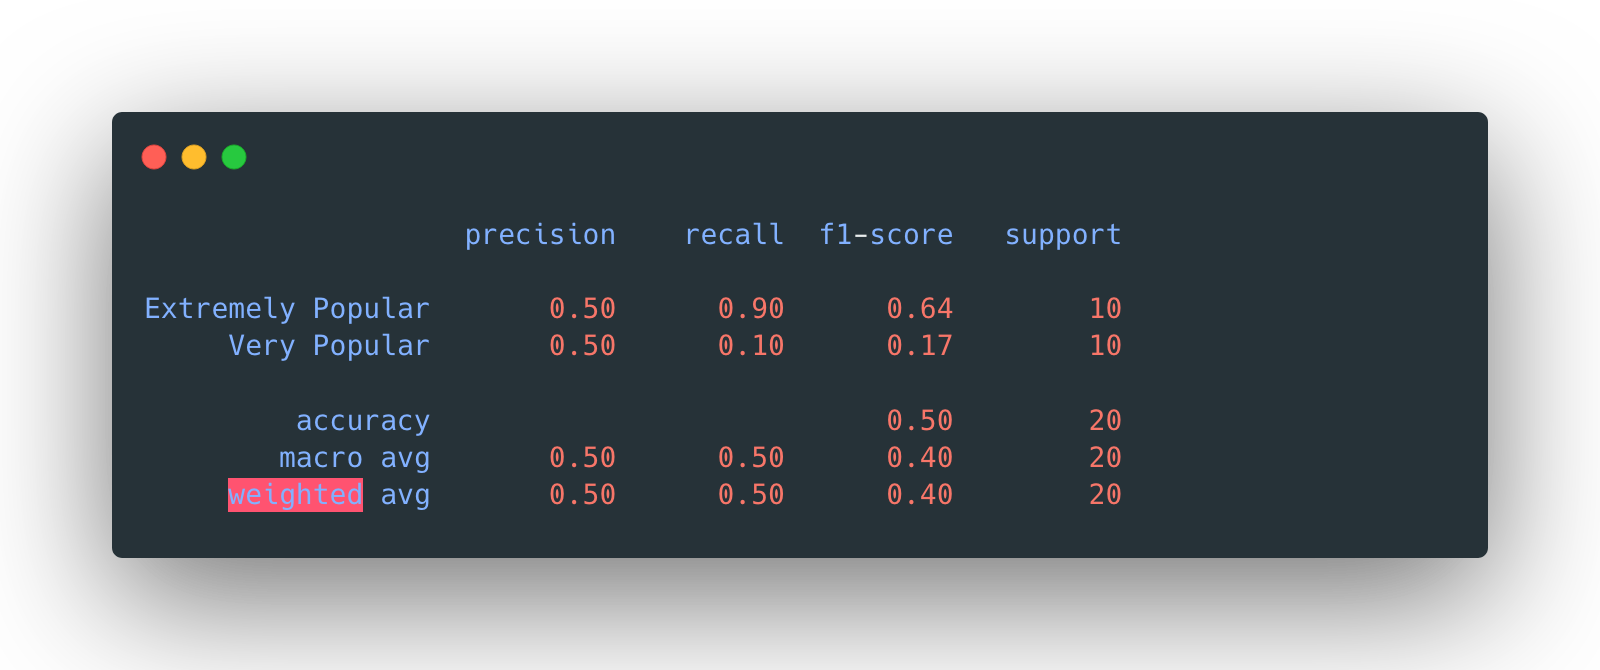
The overall accuracy is 50%.
RBF kernel
The SVM model with RBF kernel is tested for a range of different degrees, from 1 to 6.
The accuracies of these six models are:
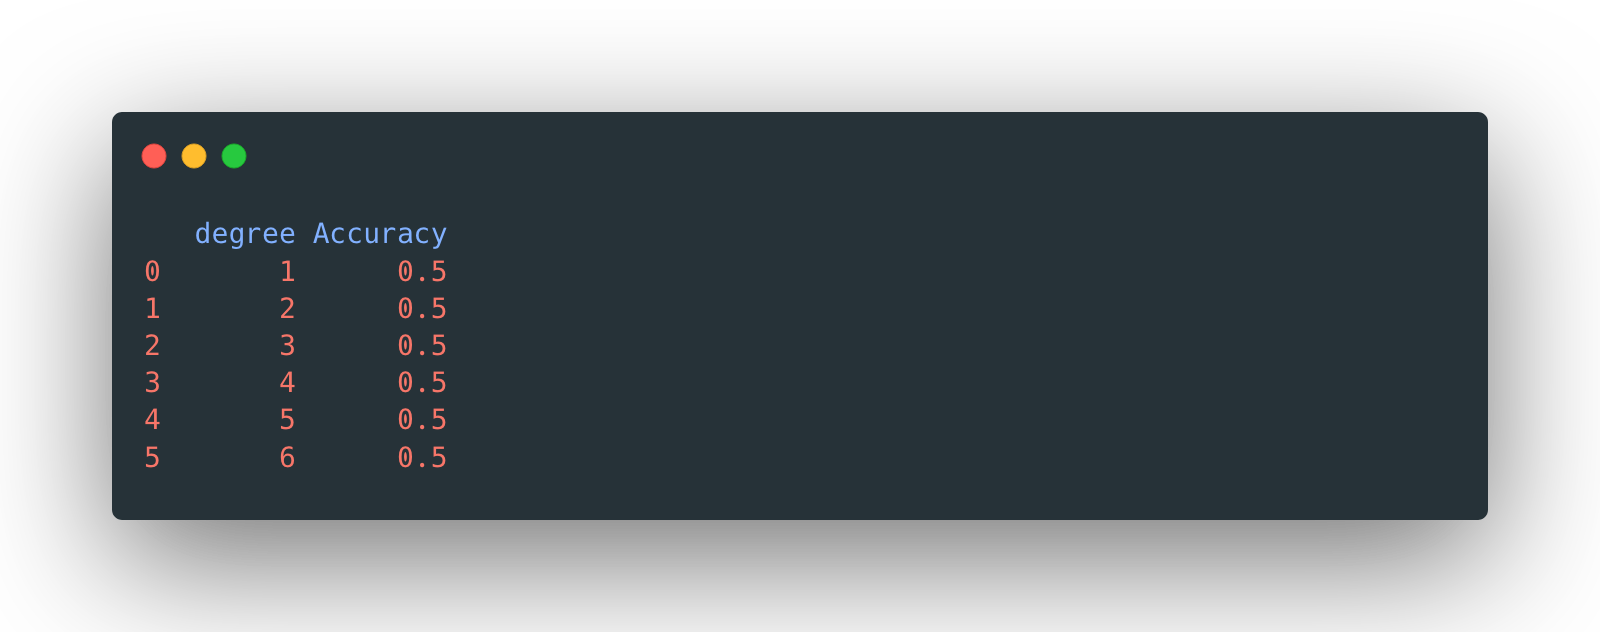
Since all the degrees lead to the same testing accuracy, the simplest one
with
degree=1 is selected as the final predictive model. Then the test data is
fitted with
this model.

Again, the overall accuracy is 50%.
Interpretation
Comparatively speaking, the linear SVM model seems to be the best one in terms of accuracy.
Recall the conclusion from last time (naïve Bayes) and the one from decision tree, it’s not hard to see the inadequacy to predict the classification based on Reddit’s title only.
Furthermore, there might be some hidden factors which affect the relative popularity and upvote ratio of a thread, like the posting time, the authenticity of the news, or the content itself (rather than the abstract headline). Also need to keep in mind that the selecting criterion above is the accuracy of a model, since there is no preference to either class. If there is a preference, the selection criterion might be shifted to precision or recall or even a weighted version of f1 score.
Another takeaway from the model comparison above is, the simpler model sometimes might just be the one with the best performance.