The underperformance of a random forest
Rui Qiu
Updated on 2021-11-05.
In this part, the data is inherited from Part 7 Decision Tree, where Stephen Curry’s three-pointer shooting data is used to build a predictive model. The goal is to rebuild the model with a random forest, expecting a better overall model performance.
Spec tuning
Just like the tuning process for decision tree models, a grid search is applied to a group of combinations of parameters.
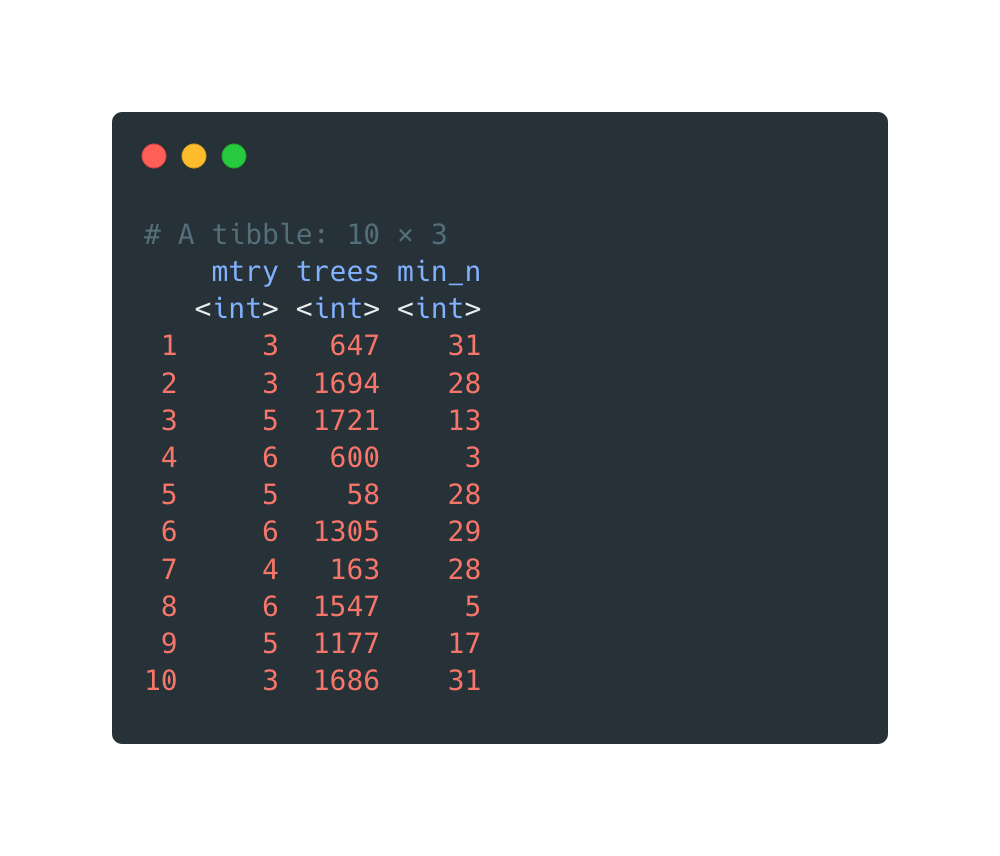
Specifically, the parametermtry() is set from 3 to 6 because there are
only 10
variables in the data set. What people usually expect from mtry() values
is that
they should be somewhere in the middle between 1 and 10, avoiding values close to the ends.
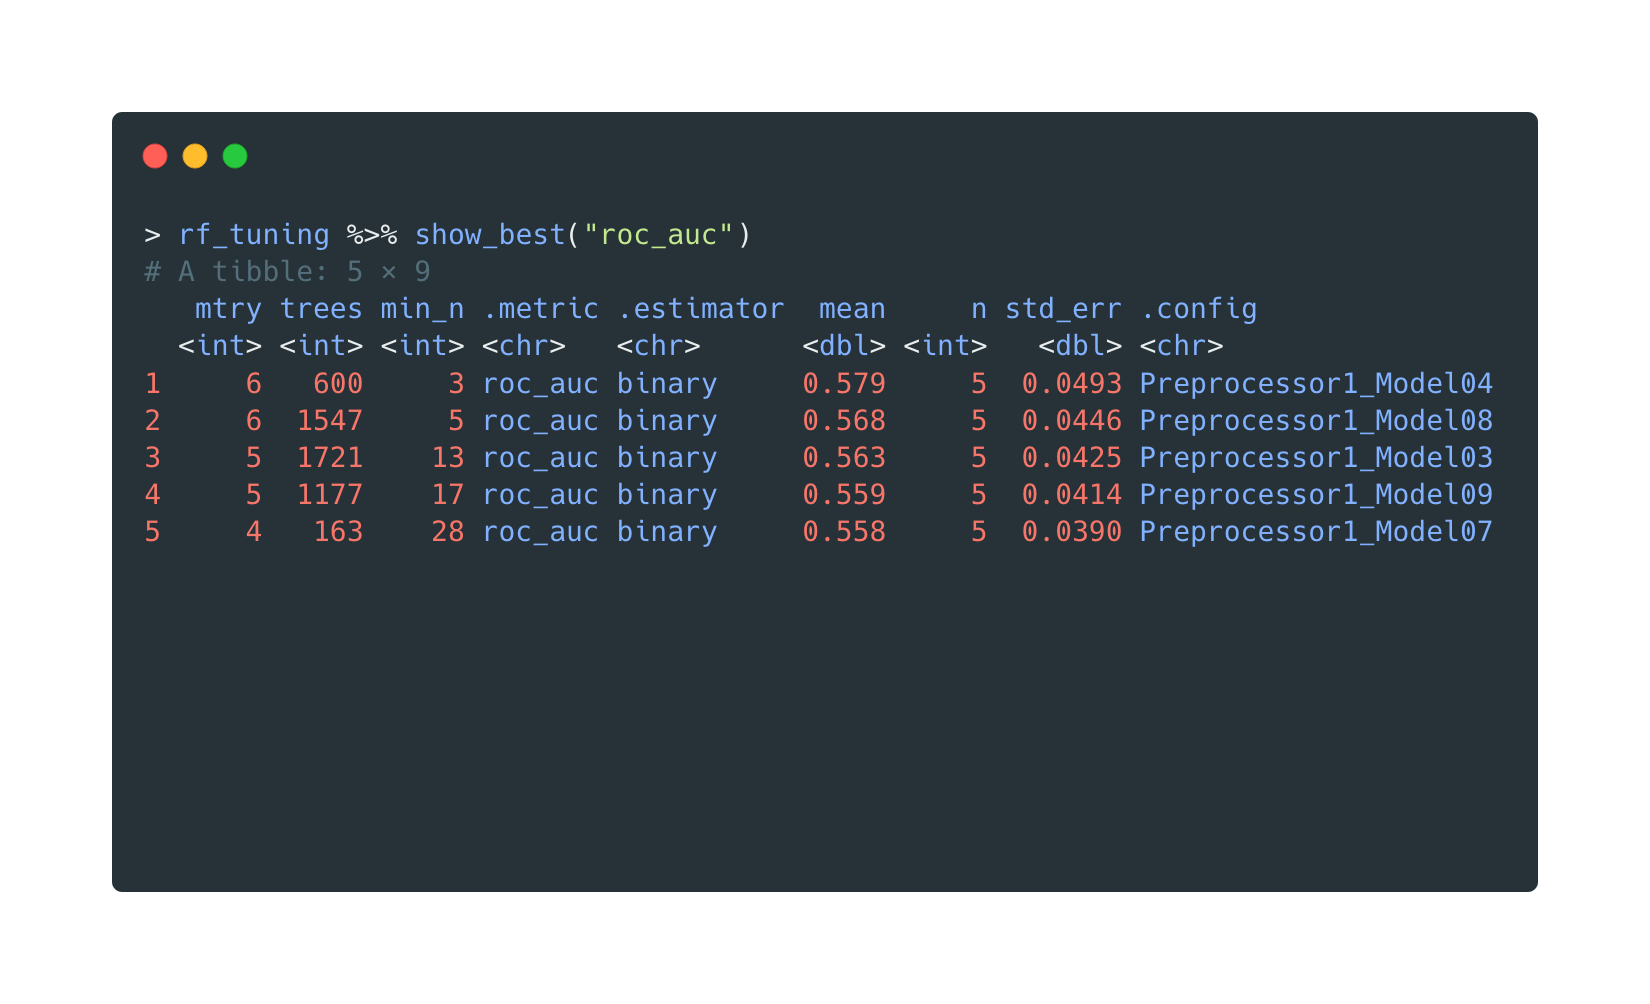
Afterwards, the show_best("roc_auc") will list the top 5 best
models
ranking by their roc_auc.
Of course, the models are trained on training data only.
Evaluation
The random forest (workflow) with the best roc_auc is chosen and fit with
training data. It generates predictions on the testing data.
last_fit() will fit our wf to the training data and genearte predictions on the testing data.
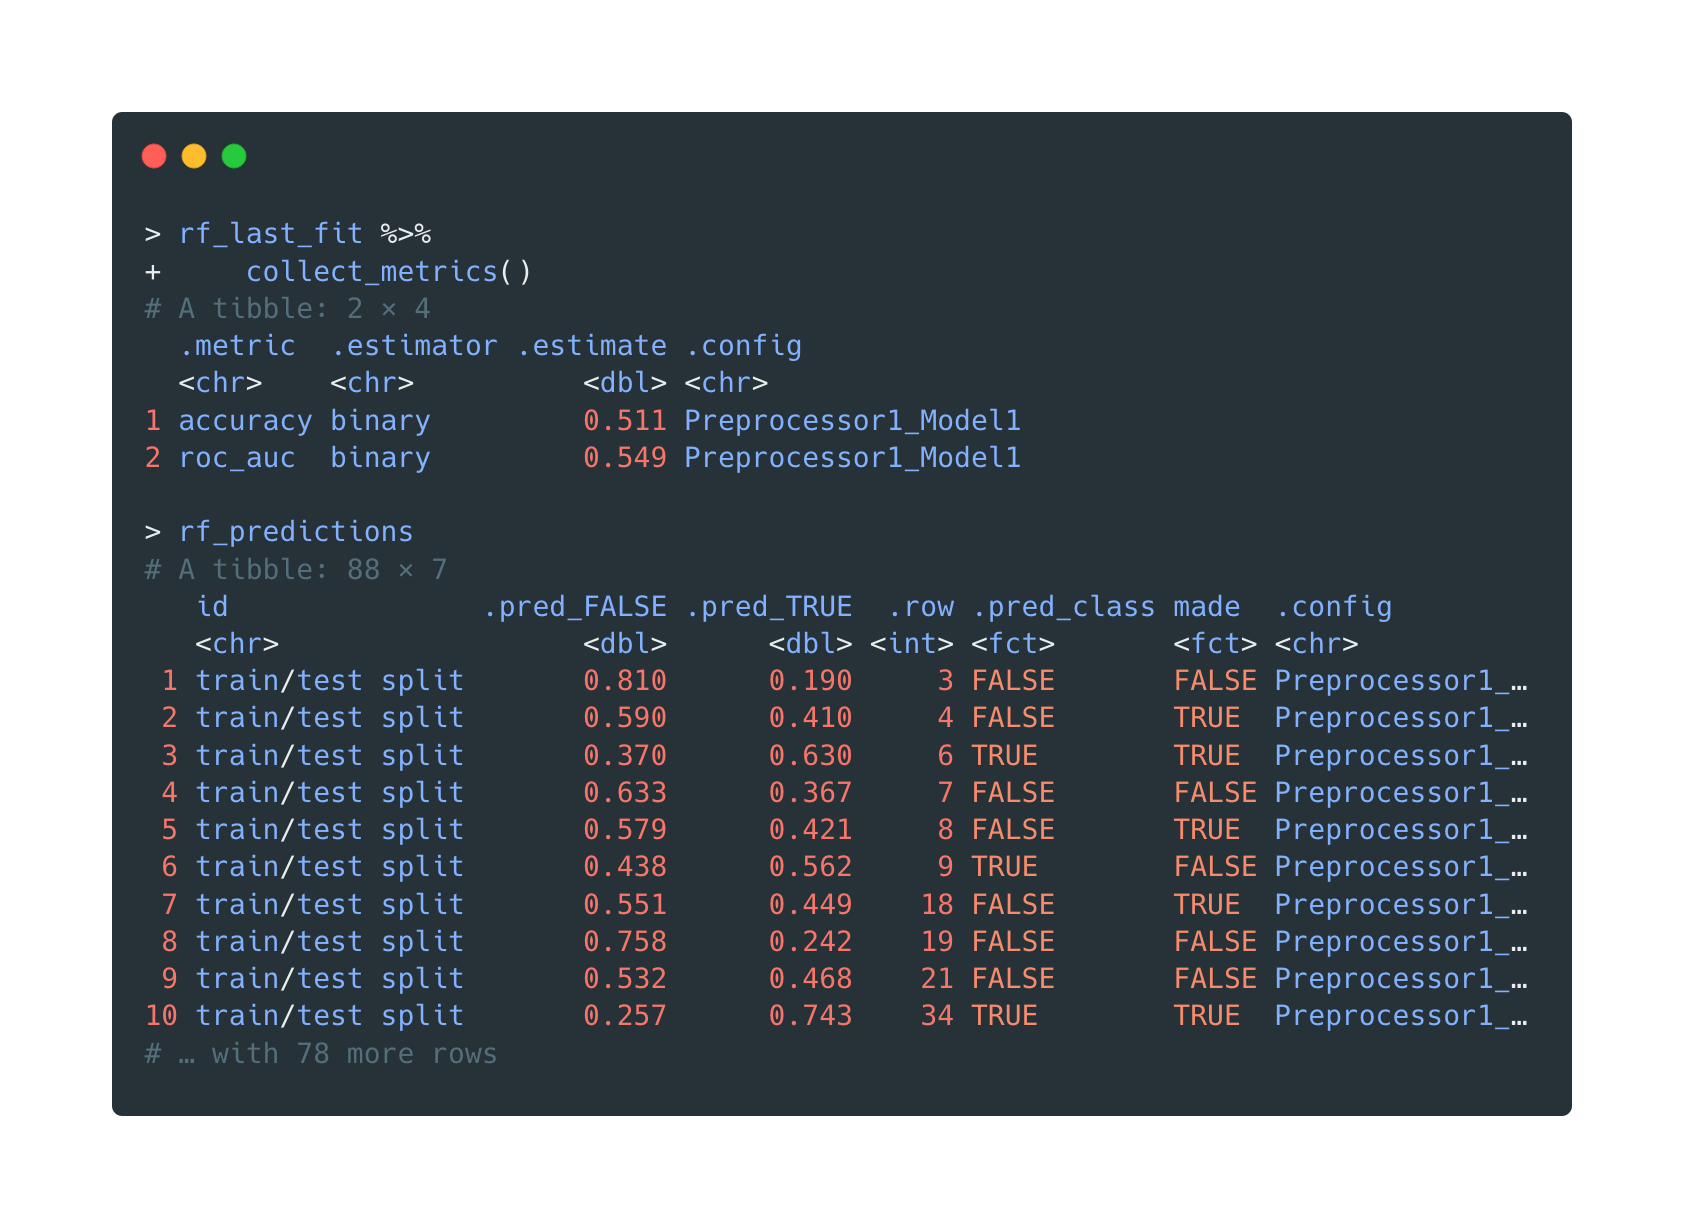
The confusion matrix, however, shows a concerning result again. The random forest barely improves the model’s performance. It’s almost a 50-50 situation once more.
| Truth | ||
|---|---|---|
| Prediction | FALSE | TRUE |
| FALSE | 24 | 21 |
| TRUE | 22 | 21 |
The in-sample accuracy of this random forest model is (24+21)/(24+21+21+22)=0.51
It's quite shocking that the accuracy is actually lower than previous three decision trees. ;)
Visualization
To visualize a random forest is always a challenge, especially with R. To start, there’s no
built-in function to plot a
{ranger} tree or a {randomForest}
tree. However, the random forest is made up of hundreds of decision trees. Plotting each of them is
definitely
not a sensible option. On the other hand, plotting a few sample trees does not actually provide any
insights.
Still, plotting the feature importance of a random forest is reasonable.
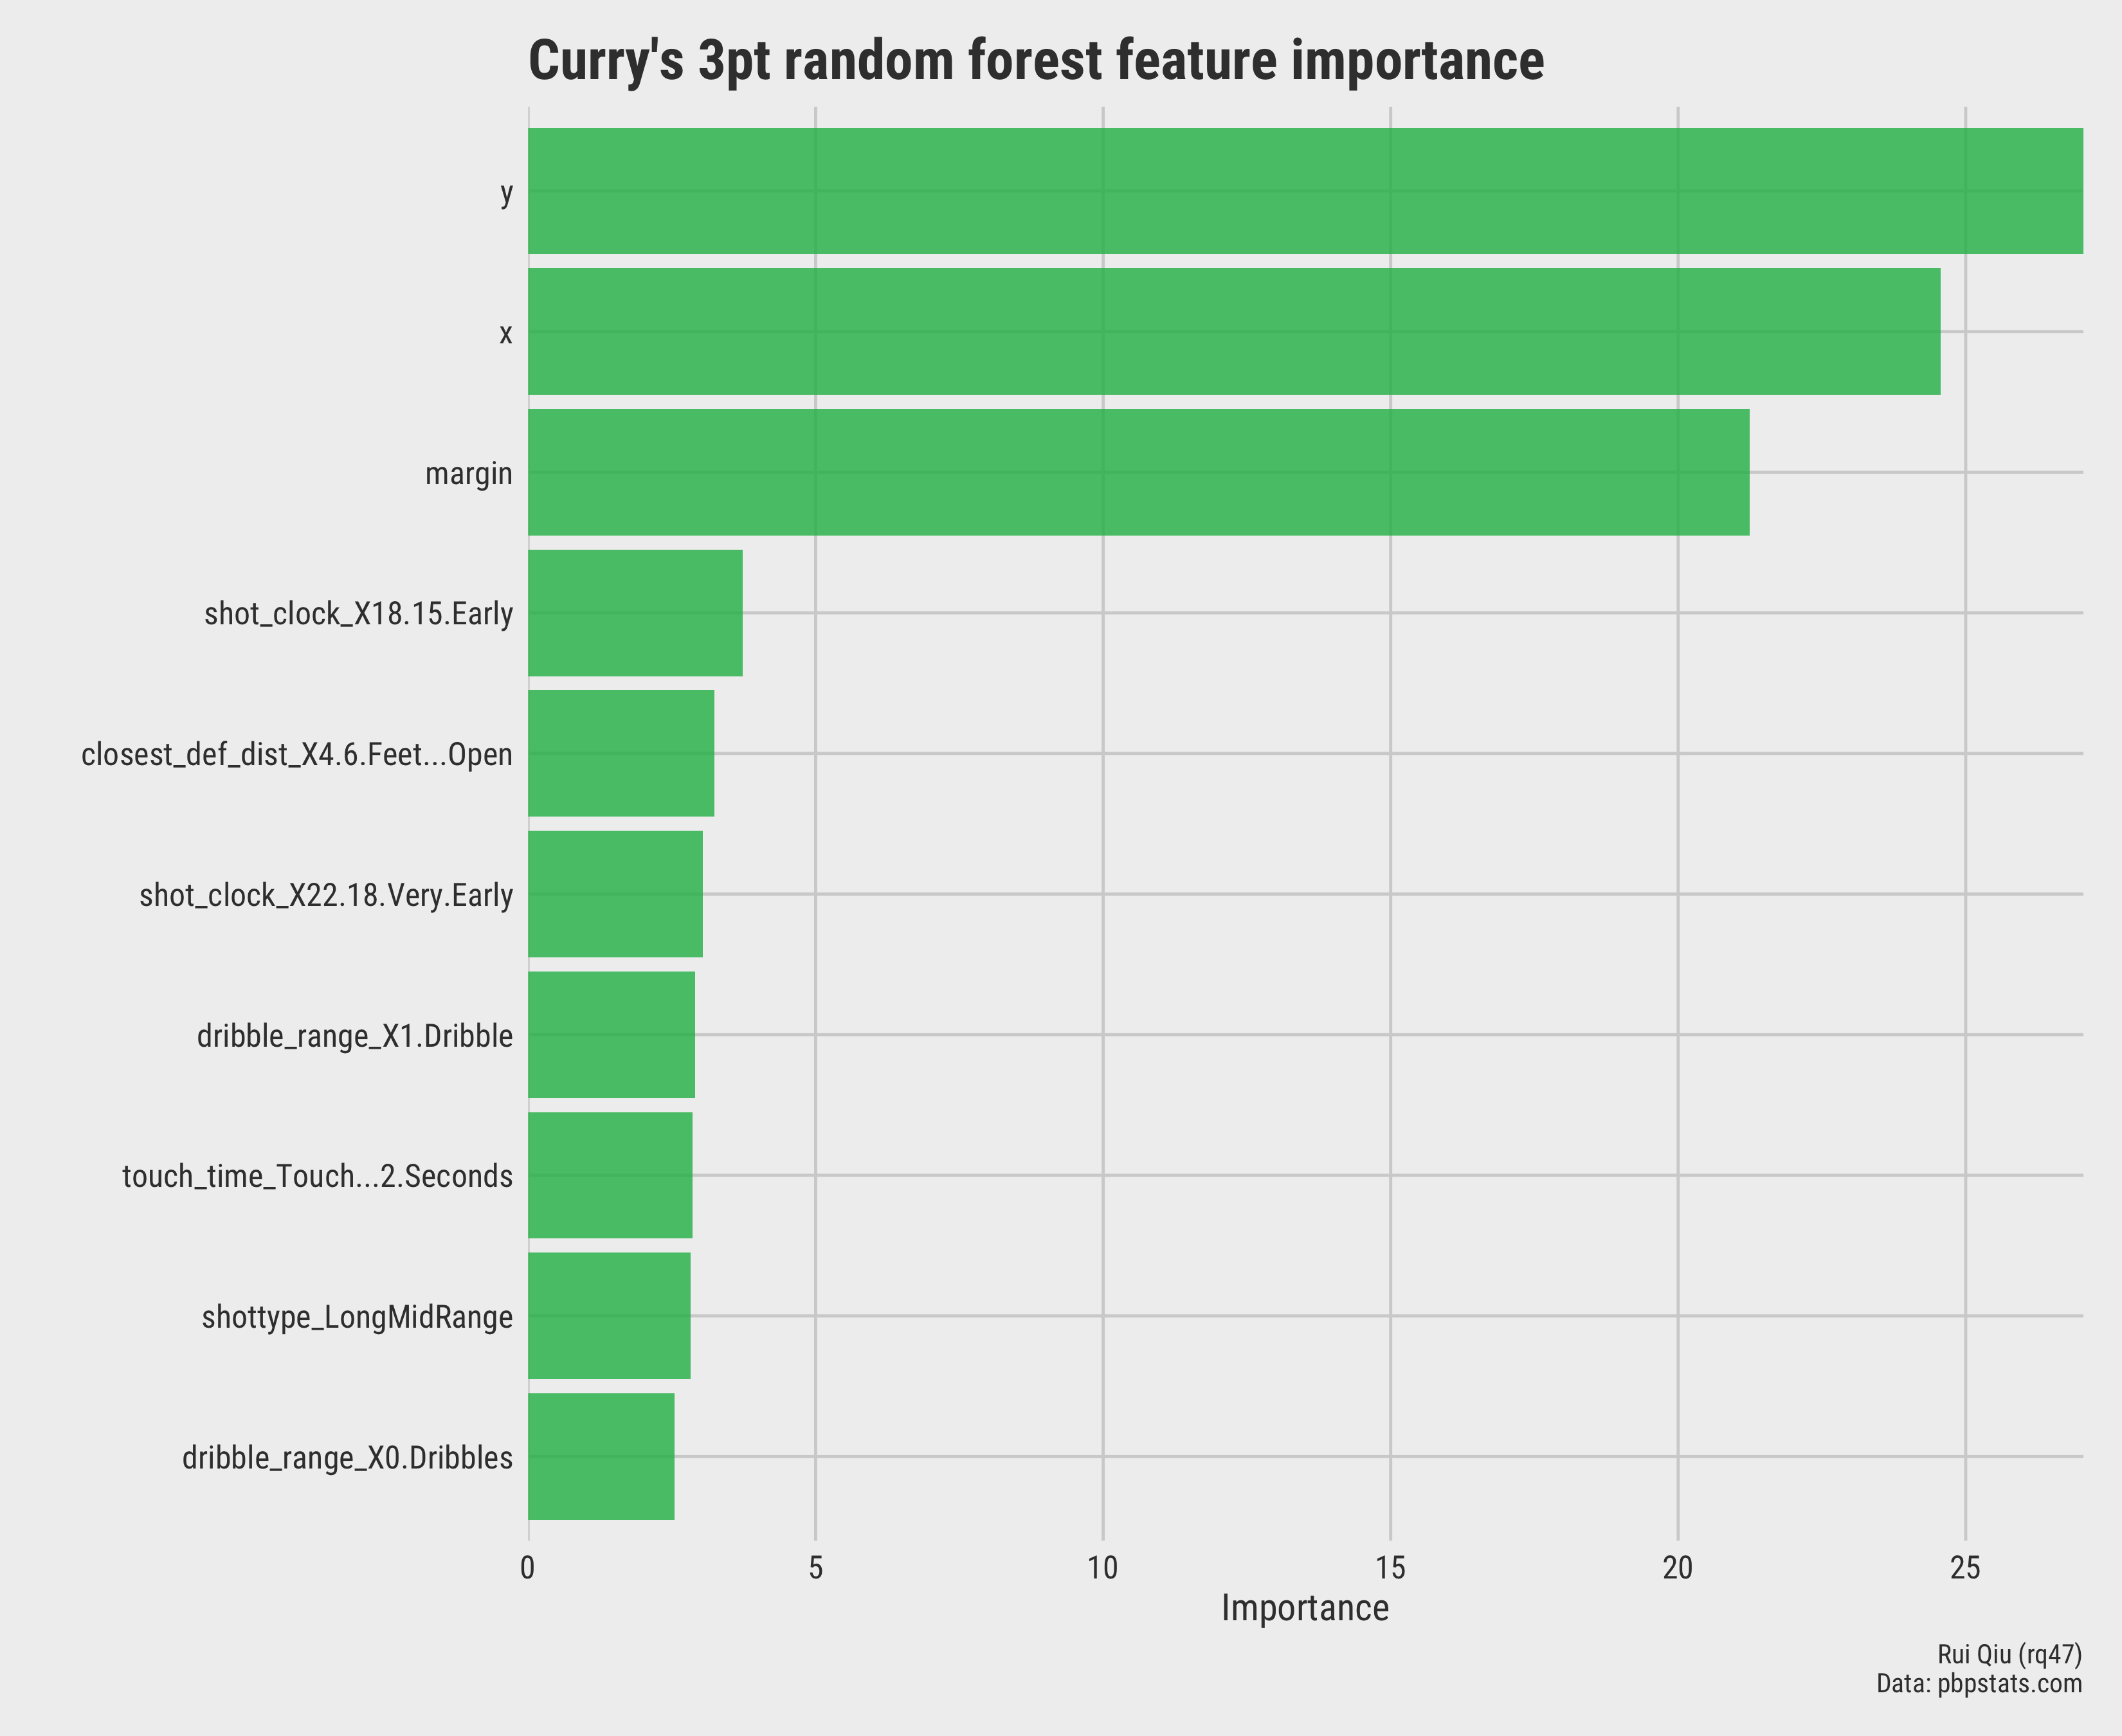
Open in new tab to see in full size.
Another workaround is to use {rfviz} to generate
interactive
plots.
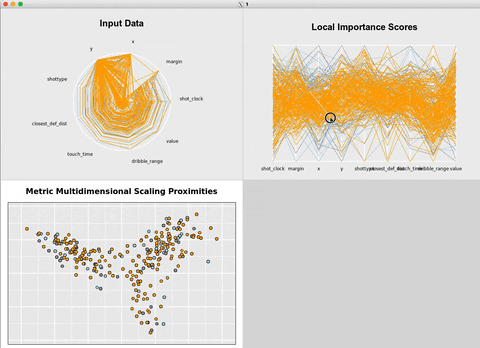
rvfizinteractive plots.
Thoughts
In the end, we still end up with an underperforming random forest model. It feels like it goes back
around and has achieved nothing. Stephen Curry’s career 3-pointers percentage is 0.432.
In other
words, technically, if a model constantly guesses the response to be
FALSE, it will
attain an overall accuracy of 1-0.432=0.568, which is close to the optimal decision tree from part
7.
A random forest is suitable for most cases where a large dataset is available, and interpretability is not a major concern.
In this post from StackExchange, Sycorax lists three cases where random forests could underperform. The following two need to be emphasized.
- Sparsity. This is not the issue in the random forest above. Still, it is a concern for the Reddit upvote ratio prediction.
- Random forests basically only work on tabular data. The
variables
xandyare the coordinates on the court, which somehow are not well-approximated by rectangular partitions.
Finally, maybe a logistic regression is a better fit in this three-pointer shooting prediction.