Tune and interpret decision trees
Rui Qiu
Updated on 2021-11-05.
In this part of the portfolio, the goal is to build a few basic decision tree models based on various selection criteria to make two rough but compelling predictions. The first one is the upvote ratio of a thread in Reddit’s subreddit r/nba. Each user-created thread’s title is entirely text-based, which is an excellent indicator of its content. Other Reddit users are capable of either upvoting or downvoting the threads based on their personal preferences. The second prediction is about if a player could make the shot in a particular on-court scenario.
Data
Script
- reddit-dt.ipynb
- reddit-scraper-v2.R
- shot-dt.R (including the random forest model tuning.)
Reddit thread upvote ratio prediction
Data
Objectively, it will be a better model if the response stays numeric since the raw data has an upvote percentage. A regression model would suffice in predicting its value. However, as required, the ratio is factorized to a set of customized strata.
The modifed scraper extracts the top 100 most upvoted Reddit threads in the past twelve months. The
ratio
of upvote/(upvote + downvote) is selected to be the dependent variable. It
is a
numeric value between 0 and 1 by nature, but manually categorized using some stratifying condition.
To be
speicifc:
- highly top rated if
upvote_ratio >= 0.95 - very top rated if
0.90 <= upvote_ratio < 0.95 - somewhat top rated if
0.80 <= upvote_ratio < 0.90 - top rated if
upvote_ratio < 0.80
The text preprocessing of thread titles includes stopwords removal, punctuation removal, and conversion to lowercase. Some meaningless, mainly the single letter first name, are also trimmed.
Then the text is tokenized with TfidfVectorizer() and transformed into a
DocumentTerm matrix.
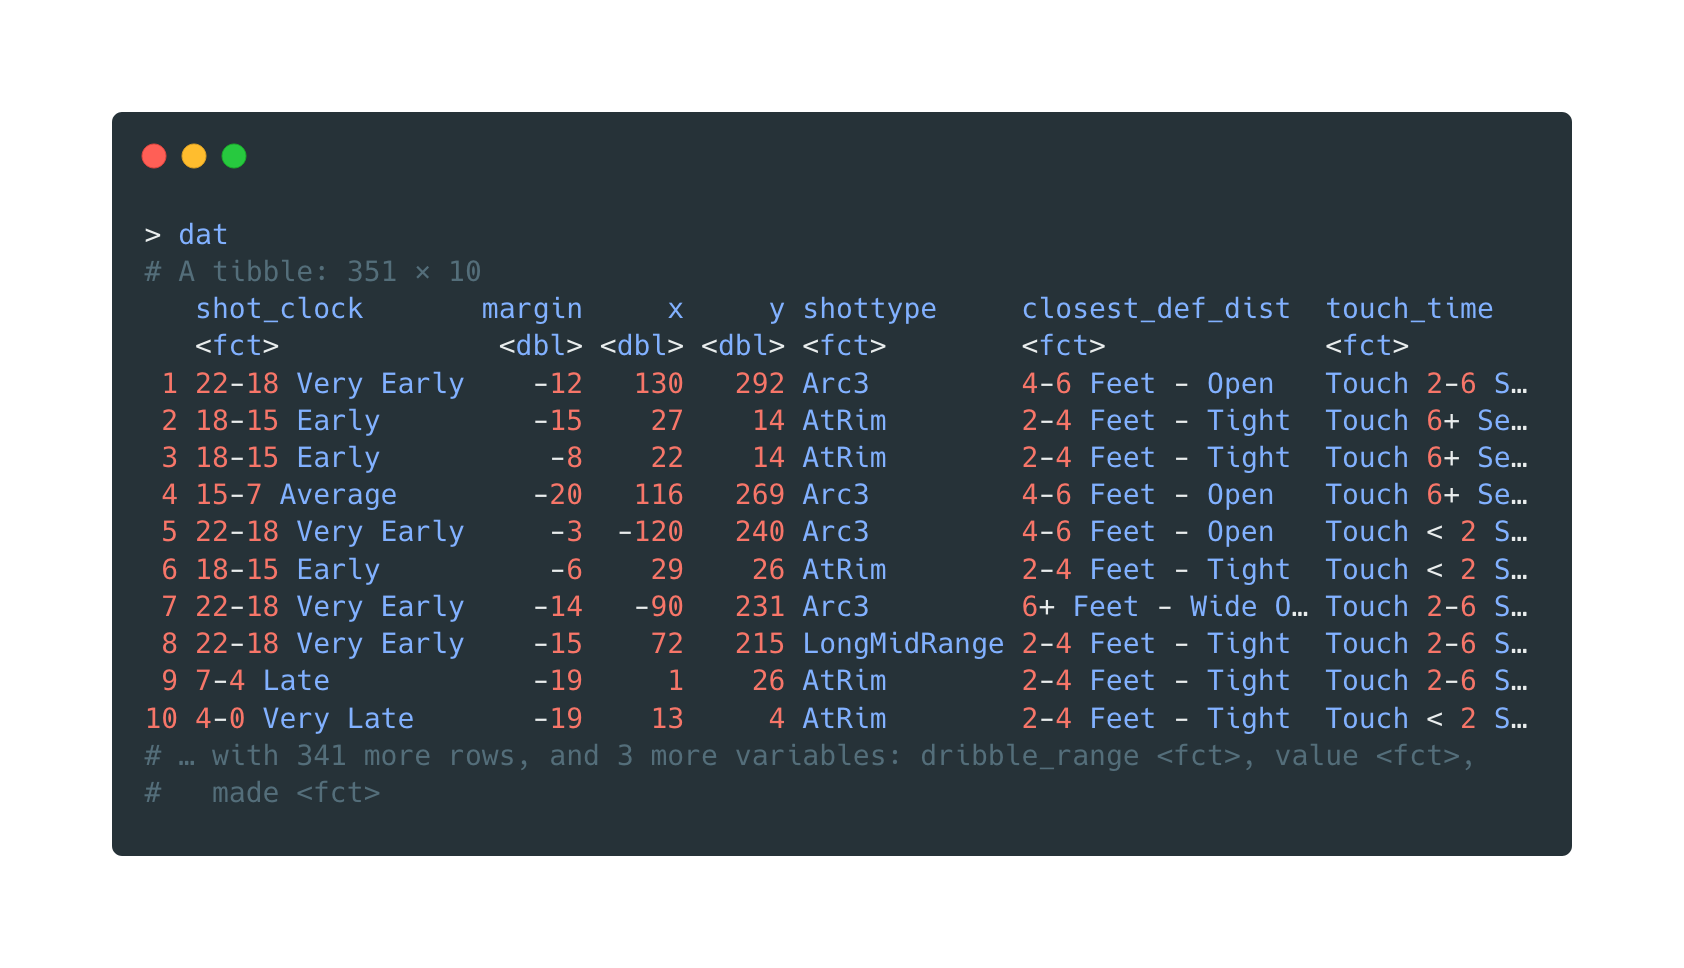
A glimpse of the data frame after cleaning is shown below:
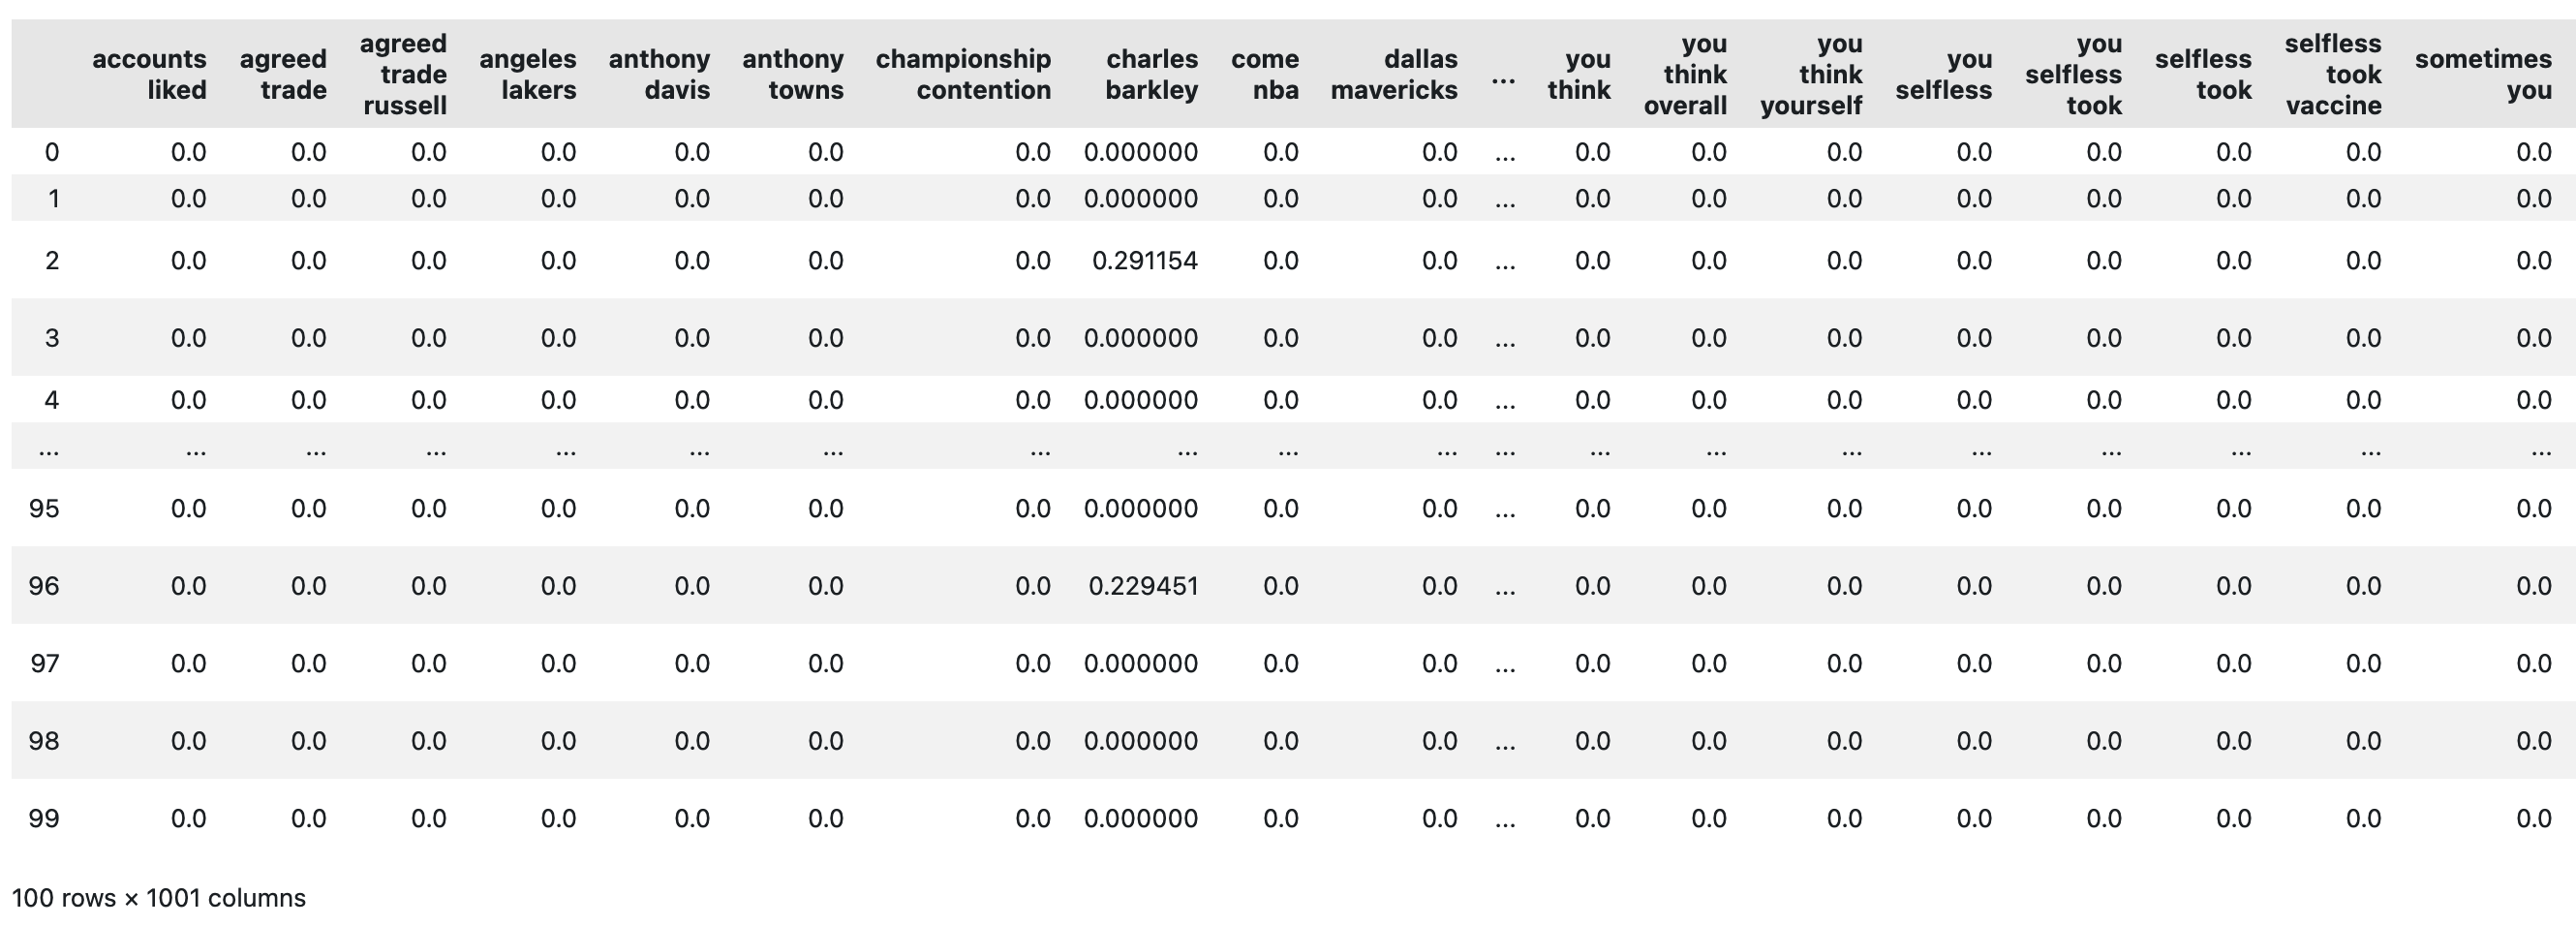
Open in new tab to see in full size.
Wordcloud
The preprocessing of text data creates bigram tokens. Therefore, the wordcloud is created in the same manner.
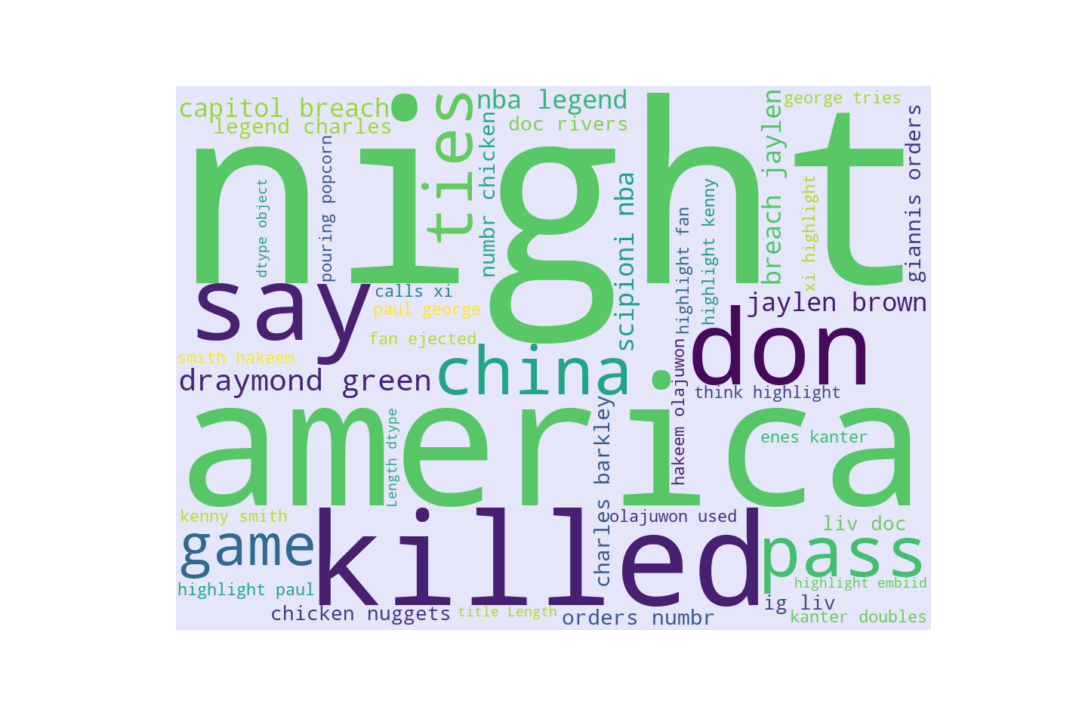
Open in new tab to see in full size.
Clearly, the unigram tokens still dominate in frequency, while some bigrams are more interpretable. Due to the limited number of threads scraped using Reddit’s public API, there is nothing profound to conclude.
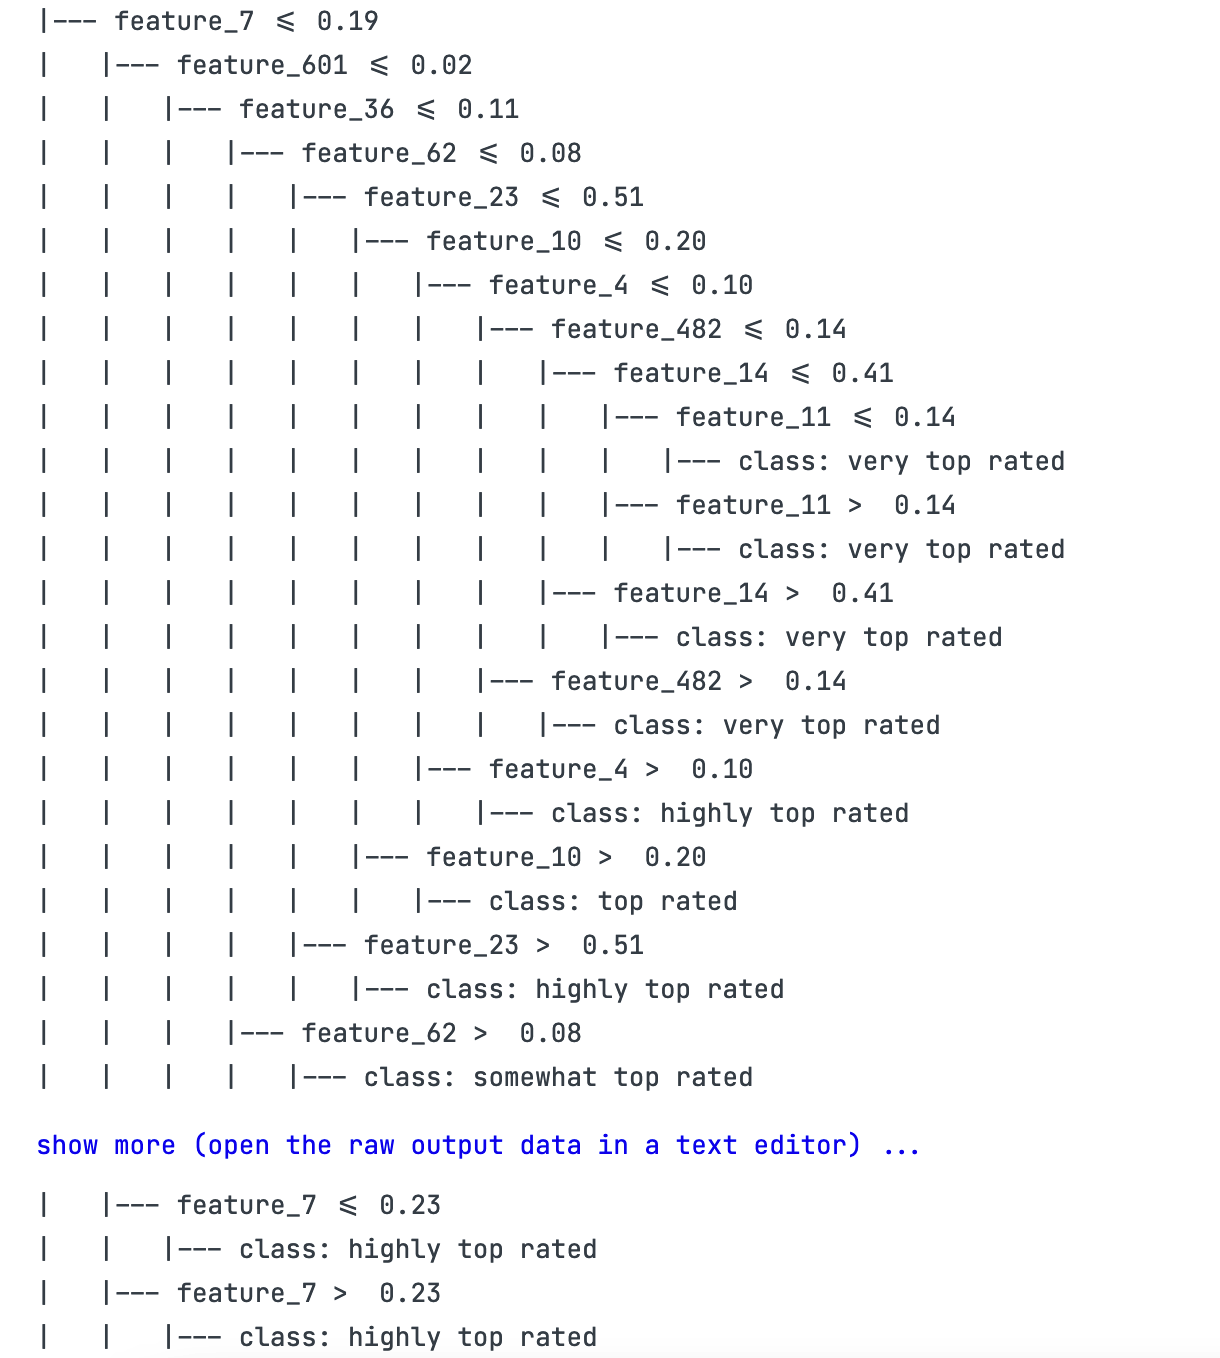
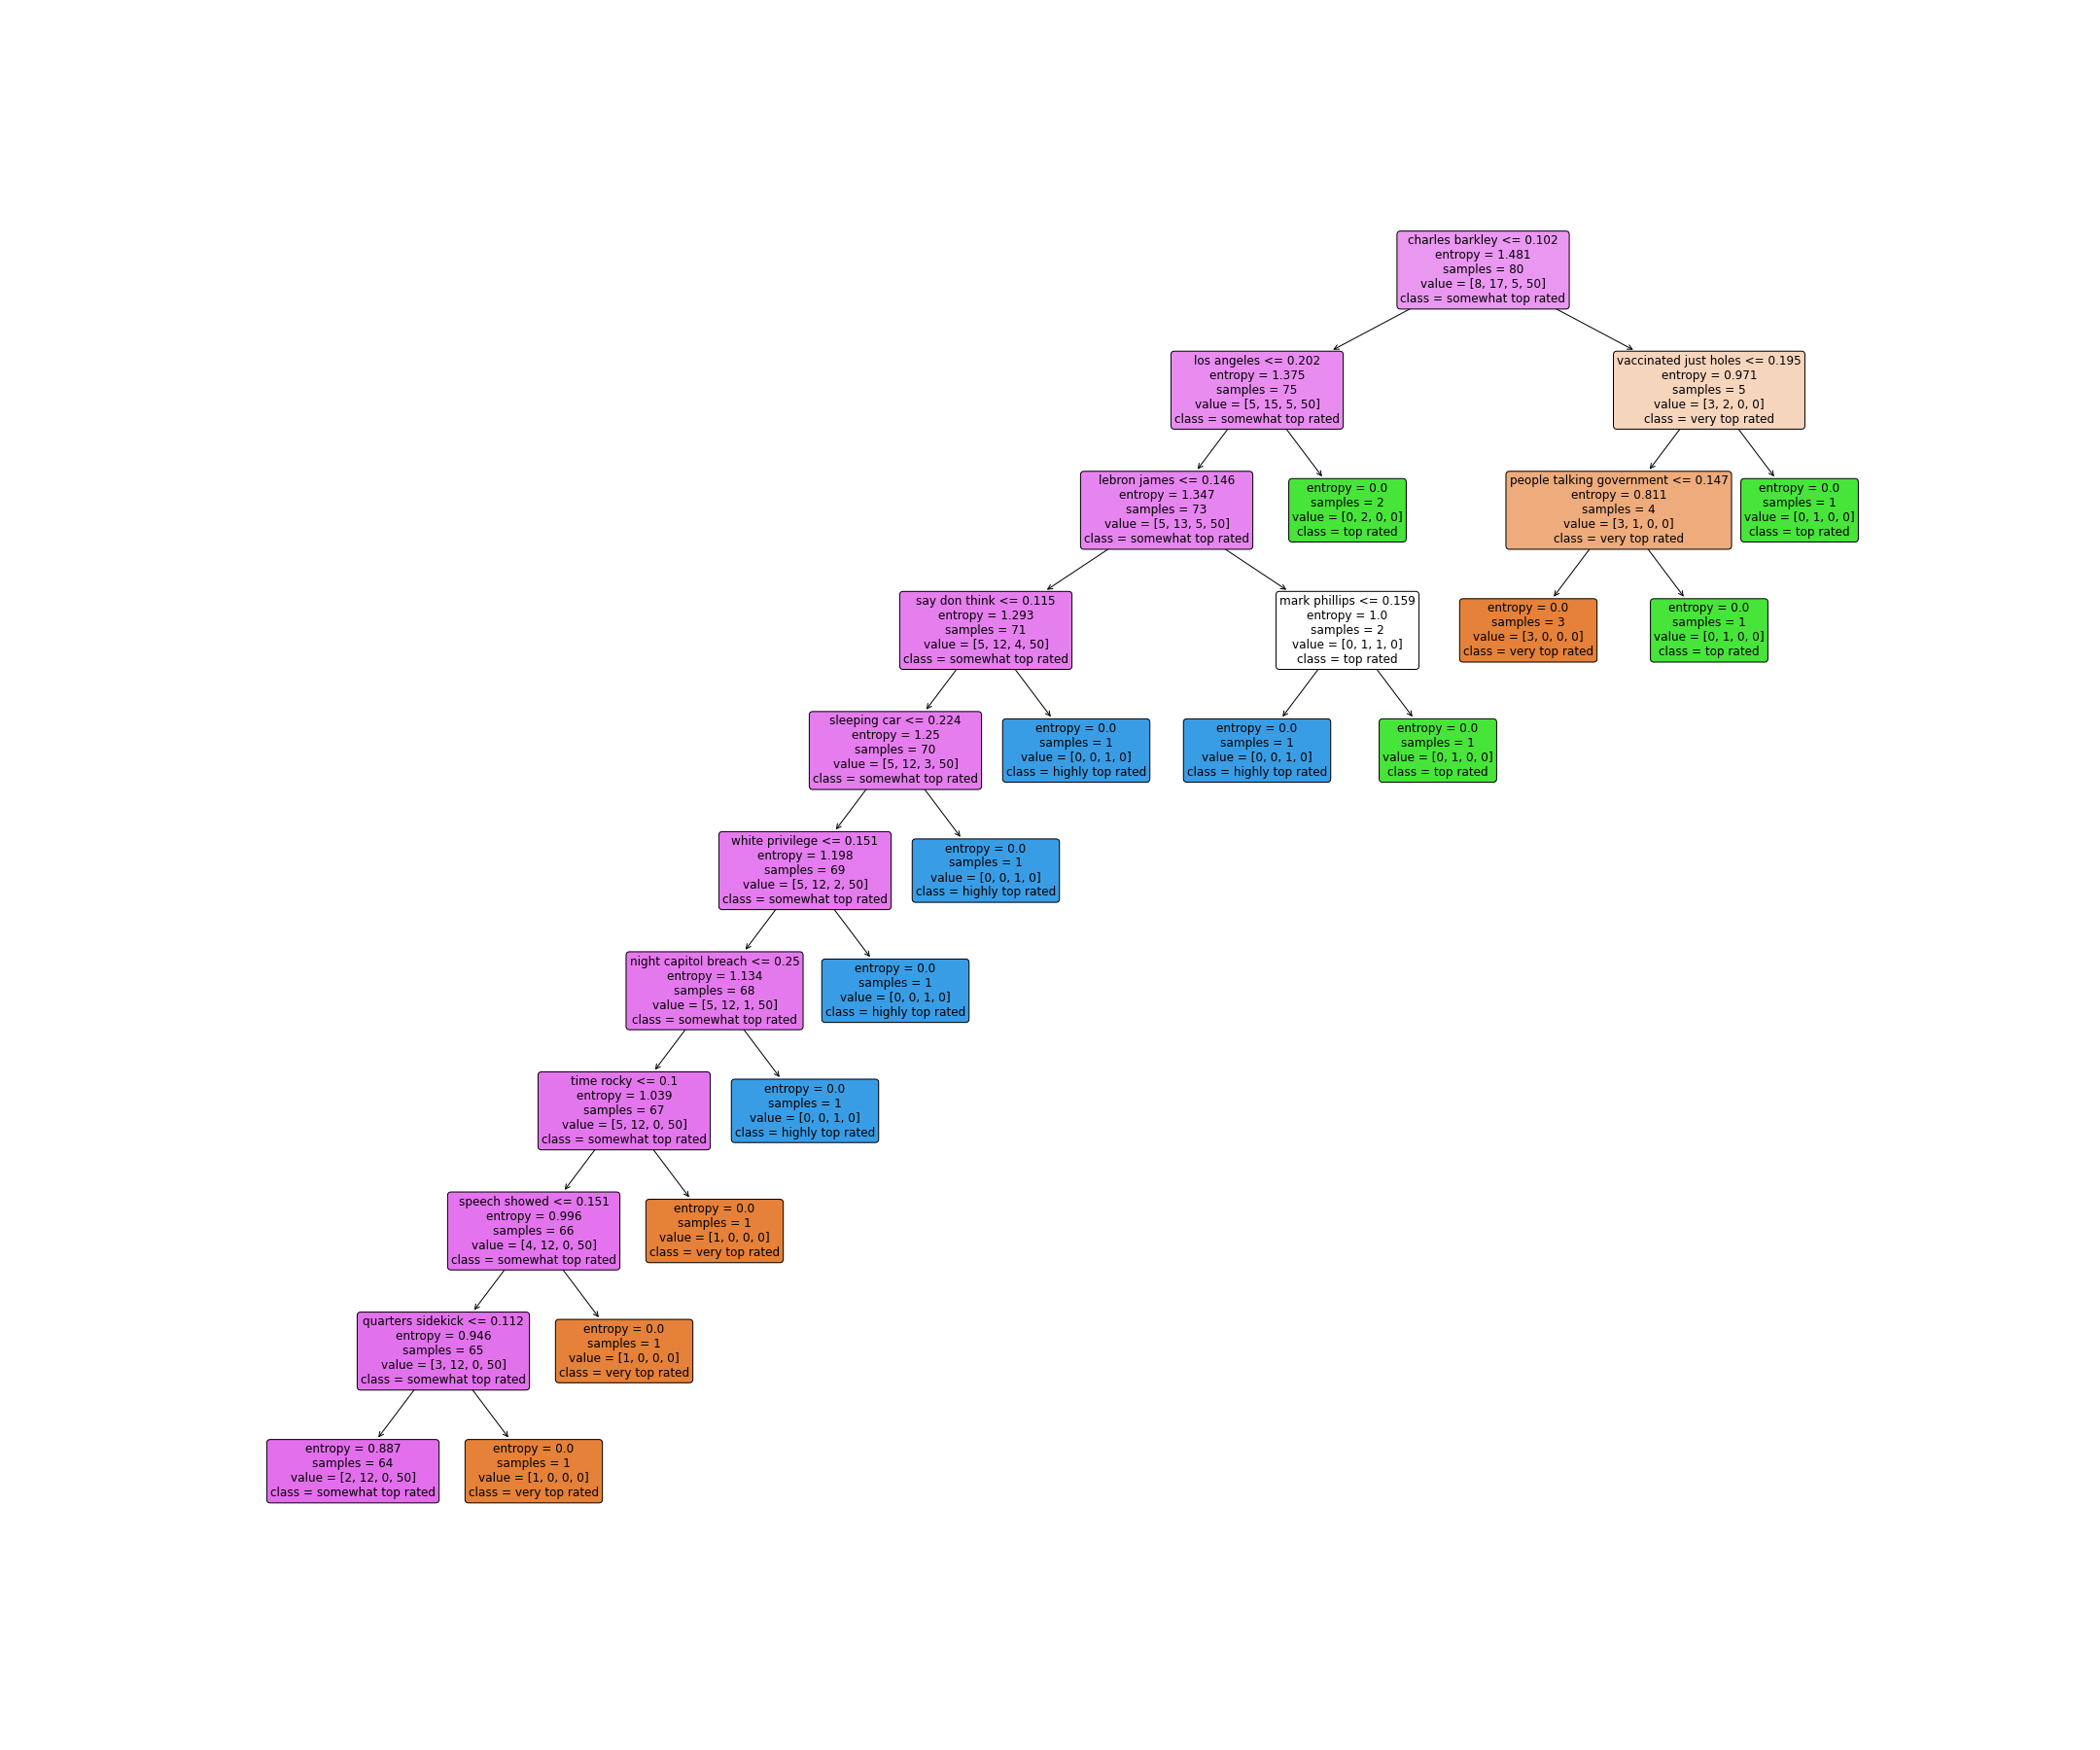
tree0: text representation
The most effortless decision tree visualization can be accomplished by applying
sklearn.tree.export_text() on a
DecisionTreeClassifier
object. Since parameter tuning is not the major focus in this chapter, a set of parameters is
selected for no
particular reason. For this one, the classifier has max_depth=10,
min_samples_leaf=2, using ‘gini’ index as the
criterion, and the splitter is set to
random. And of course, the model is trained on an 80-20 split of raw
data.
The text representation of this tree 0 is:
Open in new tab to see in full size.
tree1: split by Gini index
A more vivid visualization of the same tree is produced by
sklearn.tree.plot_tree(). There’s nothing much to tweak when drawing this
one.
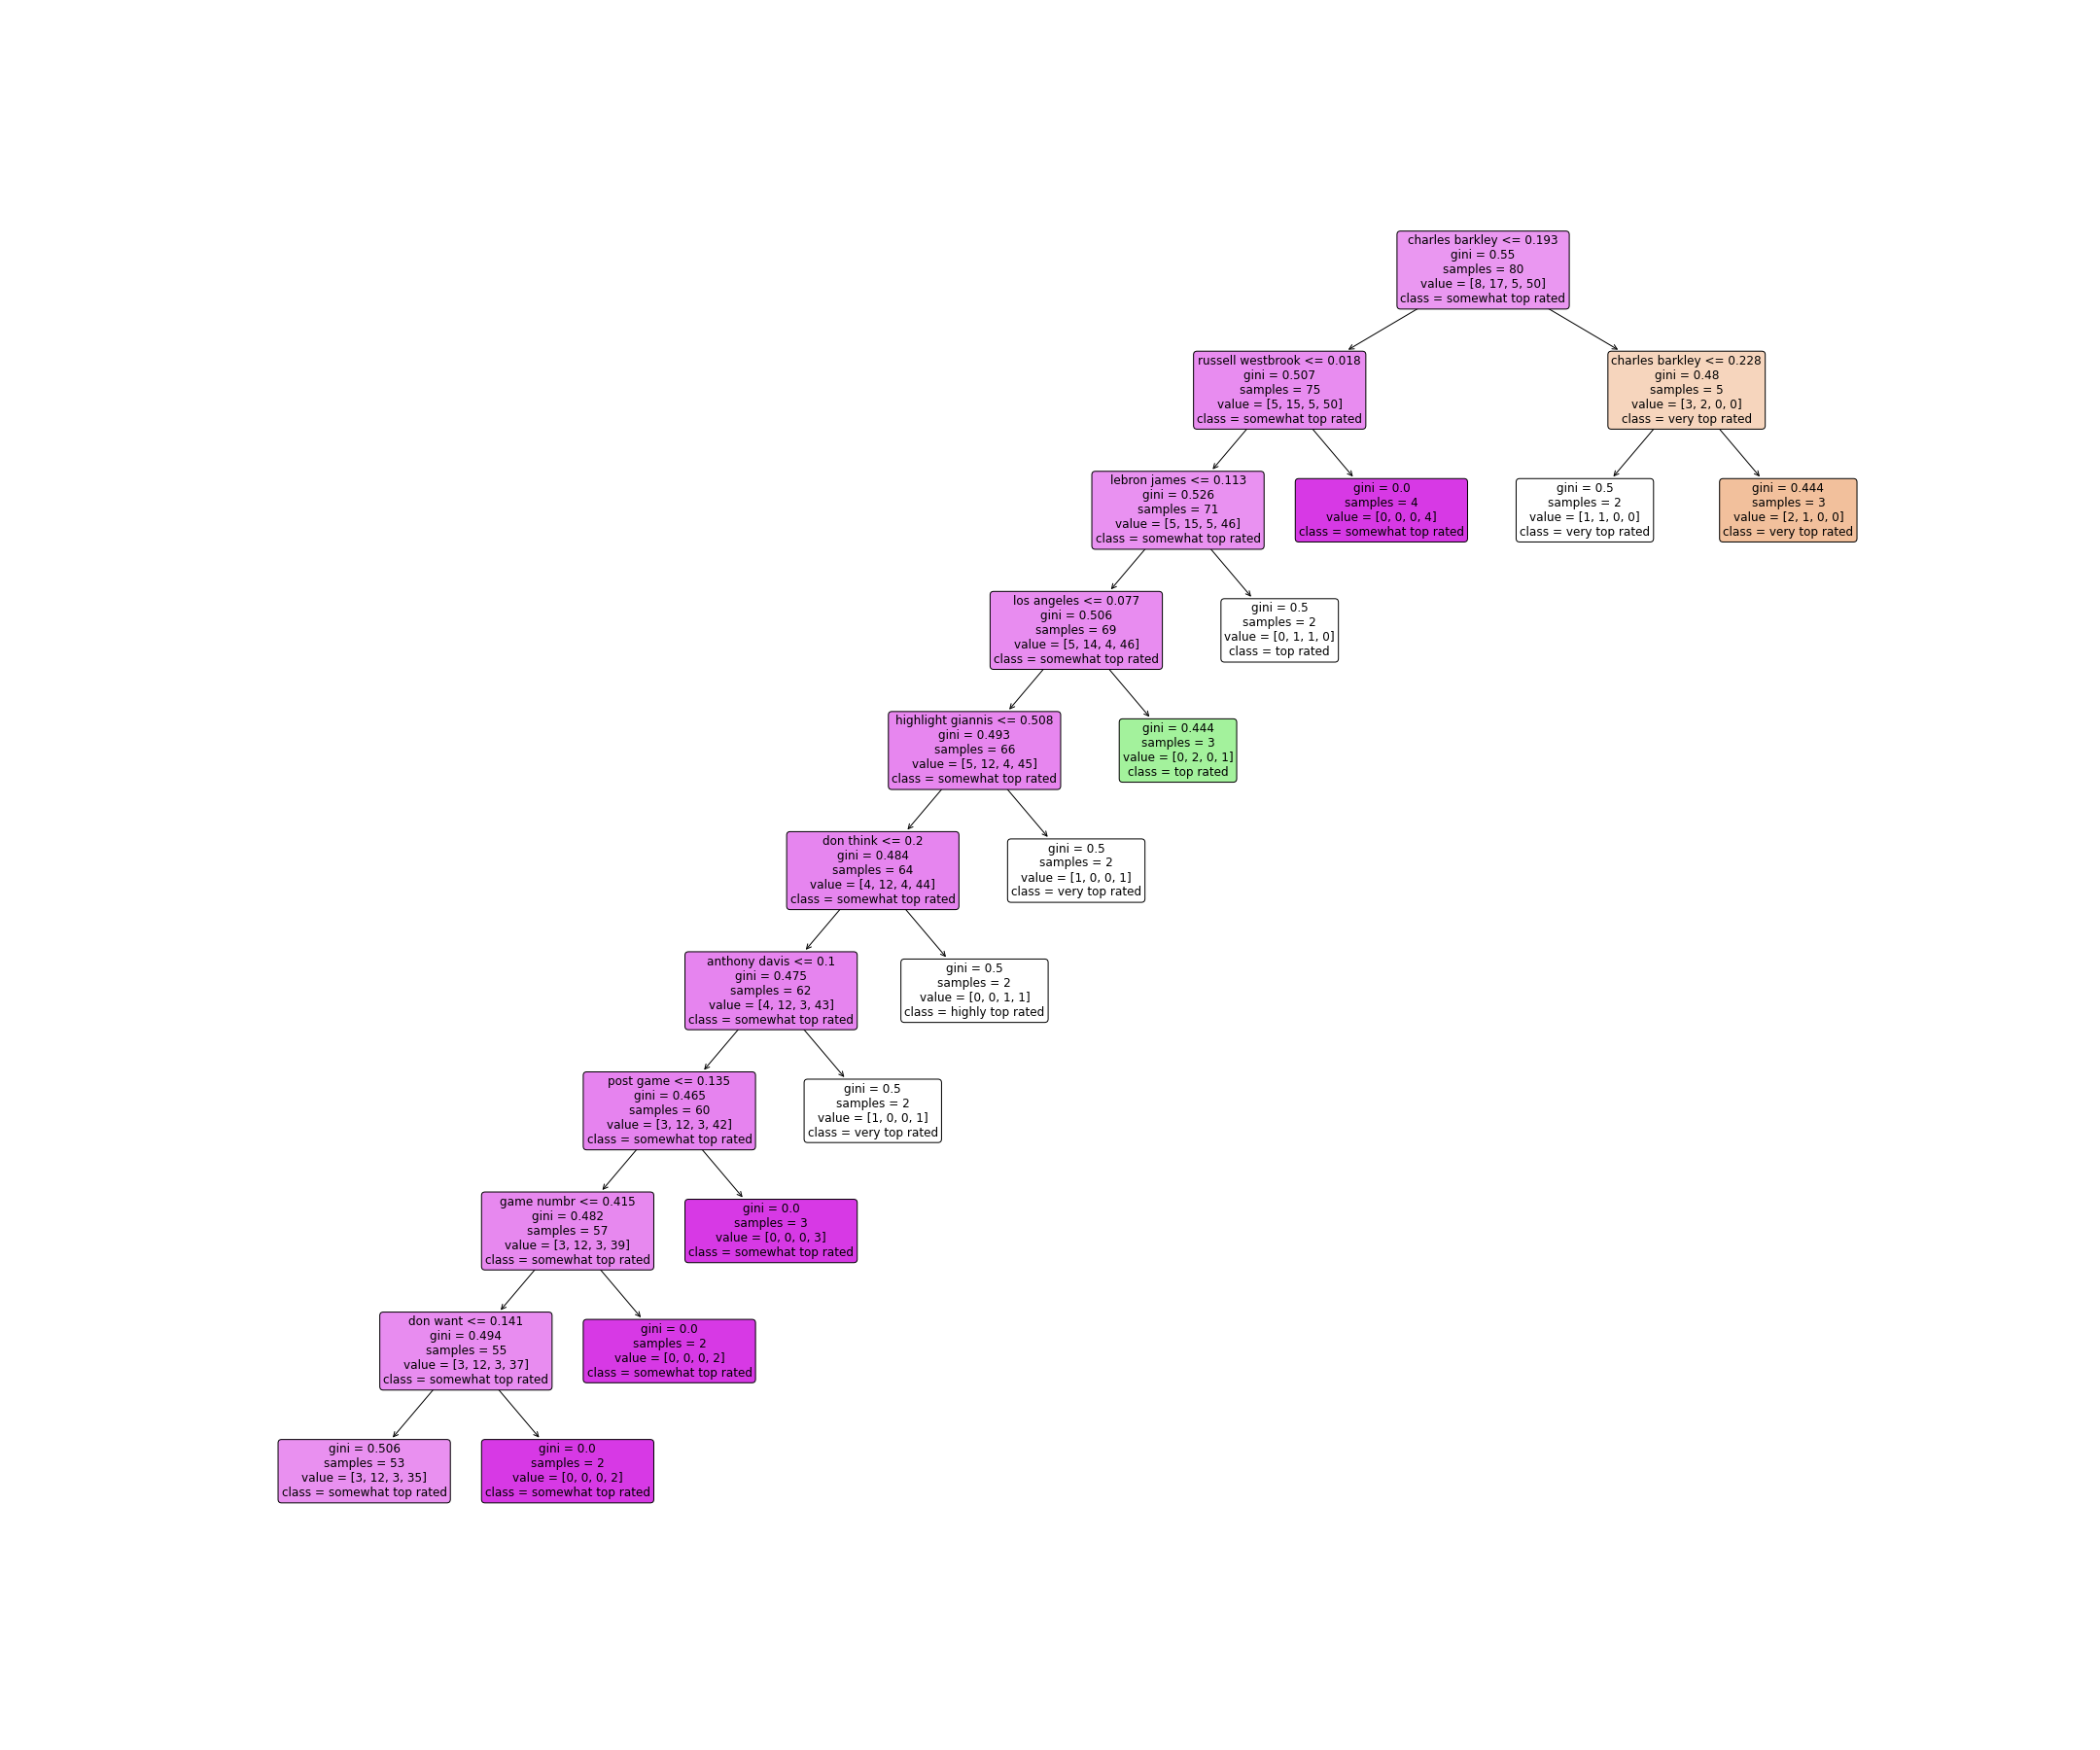
Open in new tab to see in full size.
This decision tree model has a tendency to grow “one-way.” What the model does is basically detect some keywords, then brutally slams the corresponding thread title into a category.
Open in new tab to see in full size.
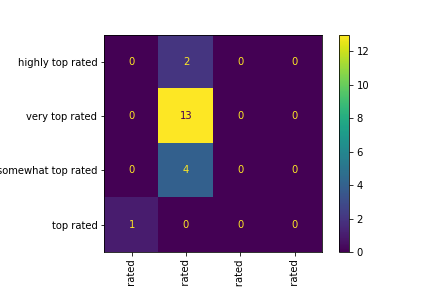
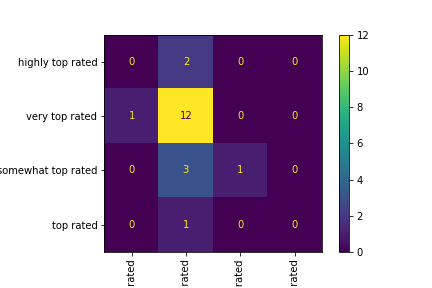
The confusion matrix is generated based on the portion of test data. The in-sample accuracy is 13/20 = 0.65
Both text and visualization versions of a confusion matrix are produced in the notebook. The
confusion
matrix indicates a high concentration on the very top rated category. All
the
samples in this category are correctly labeled. Still, as mentioned, it also seems to have a
tendency to
misclassify other types as very top rated. An educated guess would be that
the
training data is generally populated with very top rated samples, which
eventually
leads to a biased model.
tree2: split by entropy
As previously mentioned, for the next decision tree model, the focus is still not tuning parameters
for a
model with better performance. Nevertheless, while keeping the
max_depth=10, the
min_samples_leaf is set to be 1. The splitting condition is changed from Gini
index to
‘entropy’, and the splitter is set to
best. As a result, the decision tree now looks like this:
Open in new tab to see in full size.
The confusion matrix, again, indicates some lousy performance.
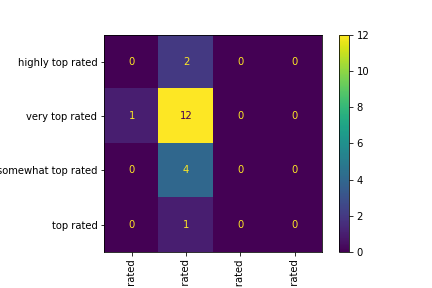
Open in new tab to see in full size.
The in-sample accuracy is 12/20 = 0.60
In fact, the only category that this decision tree’s predictions are correct about is the
very top rated one. Given the circumstance that the training and testing data
are
stratified, it really brings out a below-average accuracy. A naïve substitute for this would be,
get the counts of each category in the training data and blindly guess all the
testing data
to be in that category.
tree3: redo the decision tree with unigram tokens
At this point, one might ask: what about tokenizing the text data as unigrams instead of bigrams? Maybe decreasing the specificity in the tokens would expose some more hidden patterns within words. And at the same time, since the model is not competing with others. It is tested for prediction accuracy on both testing data and the whole set.
Open in new tab to see in full size.
It looks a little bit different from the previous bigram + entropy’s tree. The unigram model generally seems to have a smaller entropy when reaching the max depth of nodes. But the advantage is not that obvious.
Open in new tab to see in full size.
The in-sample accuracy on test data is 13/20 = 0.65 again.
The confusion matrix on testing data finally has some improvement on correctly labeling some
classes
other than very top rated.
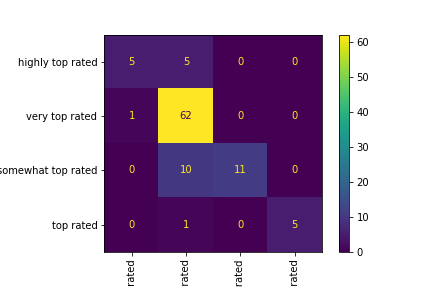
Open in new tab to see in full size.
The in-sample accuracy on complete data set is (5+62+11+5)/100=0.83
Finally, the confusion matrix on the complete data set shows some seemingly impressive accuracy in
top rated. Besides, even though the model is only 50% correct in
highly top rated and somewhat top rated, it is at
least
misclassifying them to a similar class.
Comparison of 3 DT on text data
The three decision trees above do share some similarities. For example, if a document (the title of a Reddit post) contains a TF-IDF of "Barkley" or "Charles Barkley" greater than roughly 0.2, it has a higher chance to be classified as a top-quality post. This might hints that the quote of Charles Barkley in a post title is an indicator of popularity.
As for the the effectiveness of these three trees, none of them actually clearly classify all the data. Even at the deepest nodes, the impurity of theirs are still high. Tree2 and tree3 share an entropy around 0.80, while the Gini index of tree1 is at 0.5.
The accuracy calculated by a confusion matrix tells the same story.
- The accuracy of tree1 is 13/20 = 0.65
- The accuracy of tree2 is 12/20 = 0.60
- The accuracy of tree3 is 13/20 = 0.65
- The accuracy of tree3 on complete data is 83/100 = 0.83
The sample size is quite limited, even the highest accuracy is not that ideal.
Thoughts
Honestly, all three decision trees above are not performing well. This might be caused by the size of training text, especially for this type of partitioning in supervised learning. The features acquired in training might not be as representative as expected. A large body of text data would definitely help.
A second thought: maybe the manual splitting of a numeric target is just too random. An imbalanced set of classes increases the classification difficulty.
Nevertheless, hopefully after some parameter tuning, the models can contribute more to predicting the post quality. Still, the first predictive model is labeled as a classification task. An alternative regression model should suffice with the raw data. Anyways, it is a test run by the end of the day.
Stephen Curry's three-point shooting prediction
On to the next part, it investigates some on-court offensive situations that a player could face. This is different from the study on shot selection last time. Hopefully, after some parameter tweaking, a decision tree could accurately predict if a shot is going in.
Data

This model utilizes the play-by-play shot attempts data. A slice of Stephen Curry’s 3-point shots is the object of interest for the decision tree training.
Open in new tab to see in full size.
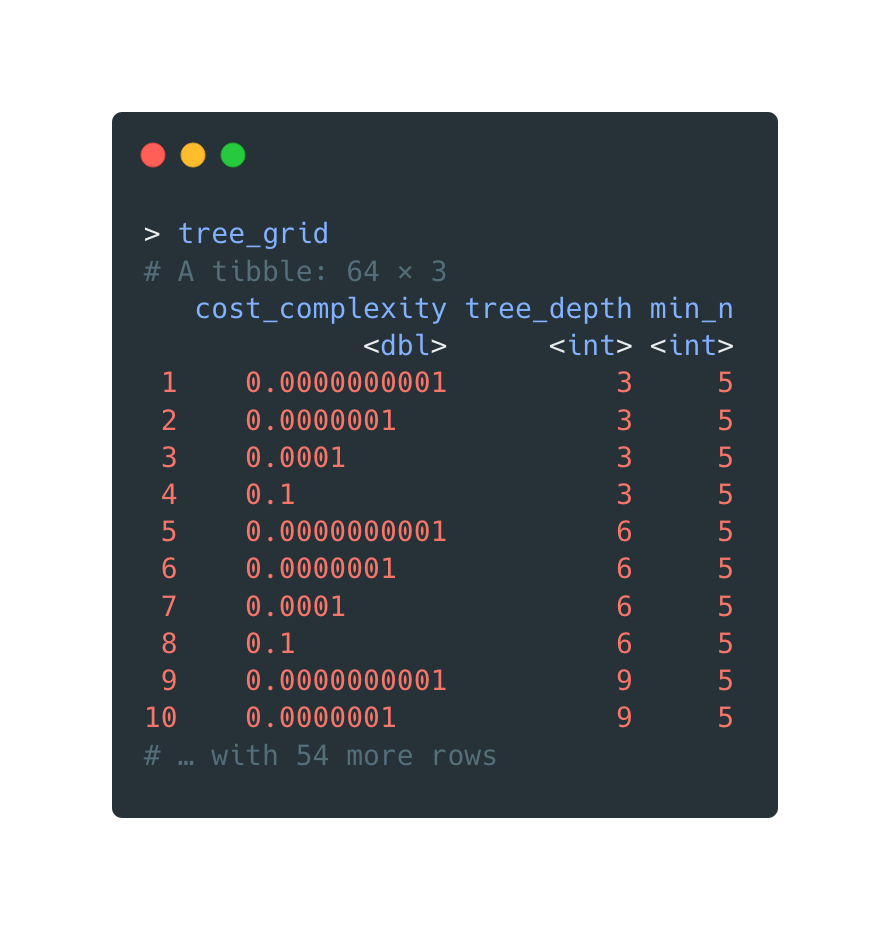
Spec tuning
The data is divided into 5 folds, and different combinations of parameters are tested for the best
performance. The process closely follows the R package {tidymodels}'s
documentation.
A 4-level gird search is applied for testing the optimal combo of parameters.
Open in new tab to see in full size.
The model training process takes over than one minute. Two metrics for classification are
considered:
accuracy and roc_auc.
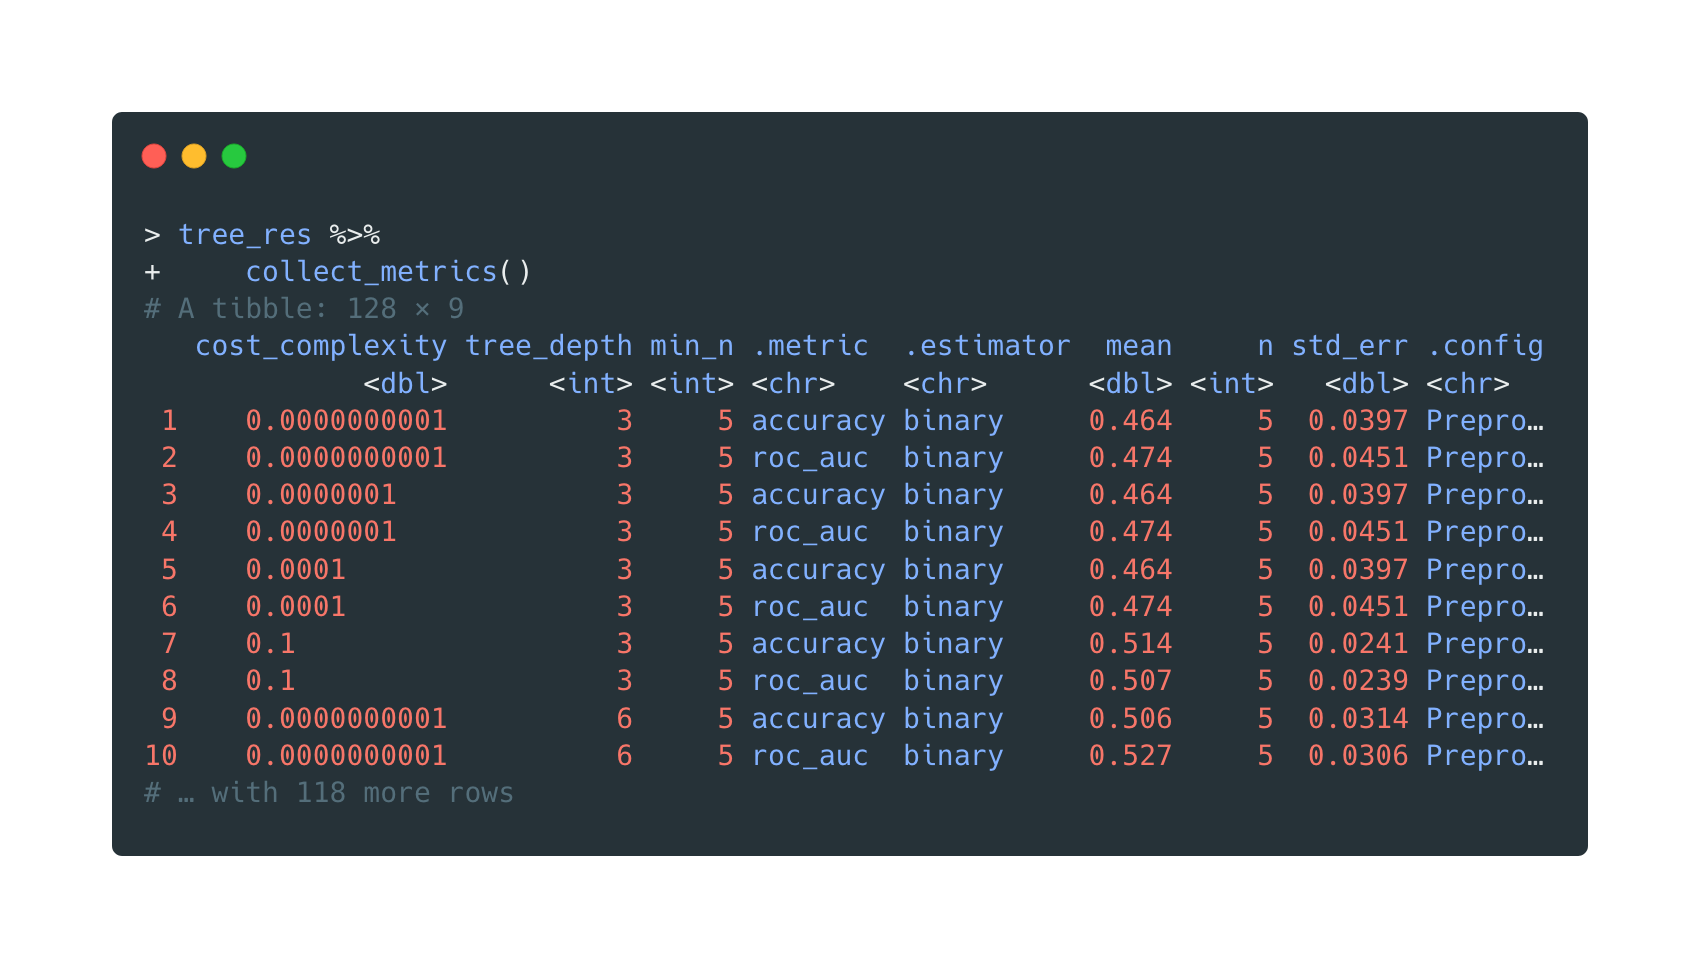
Open in new tab to see in full size.
The model selection step can be visualized as below:
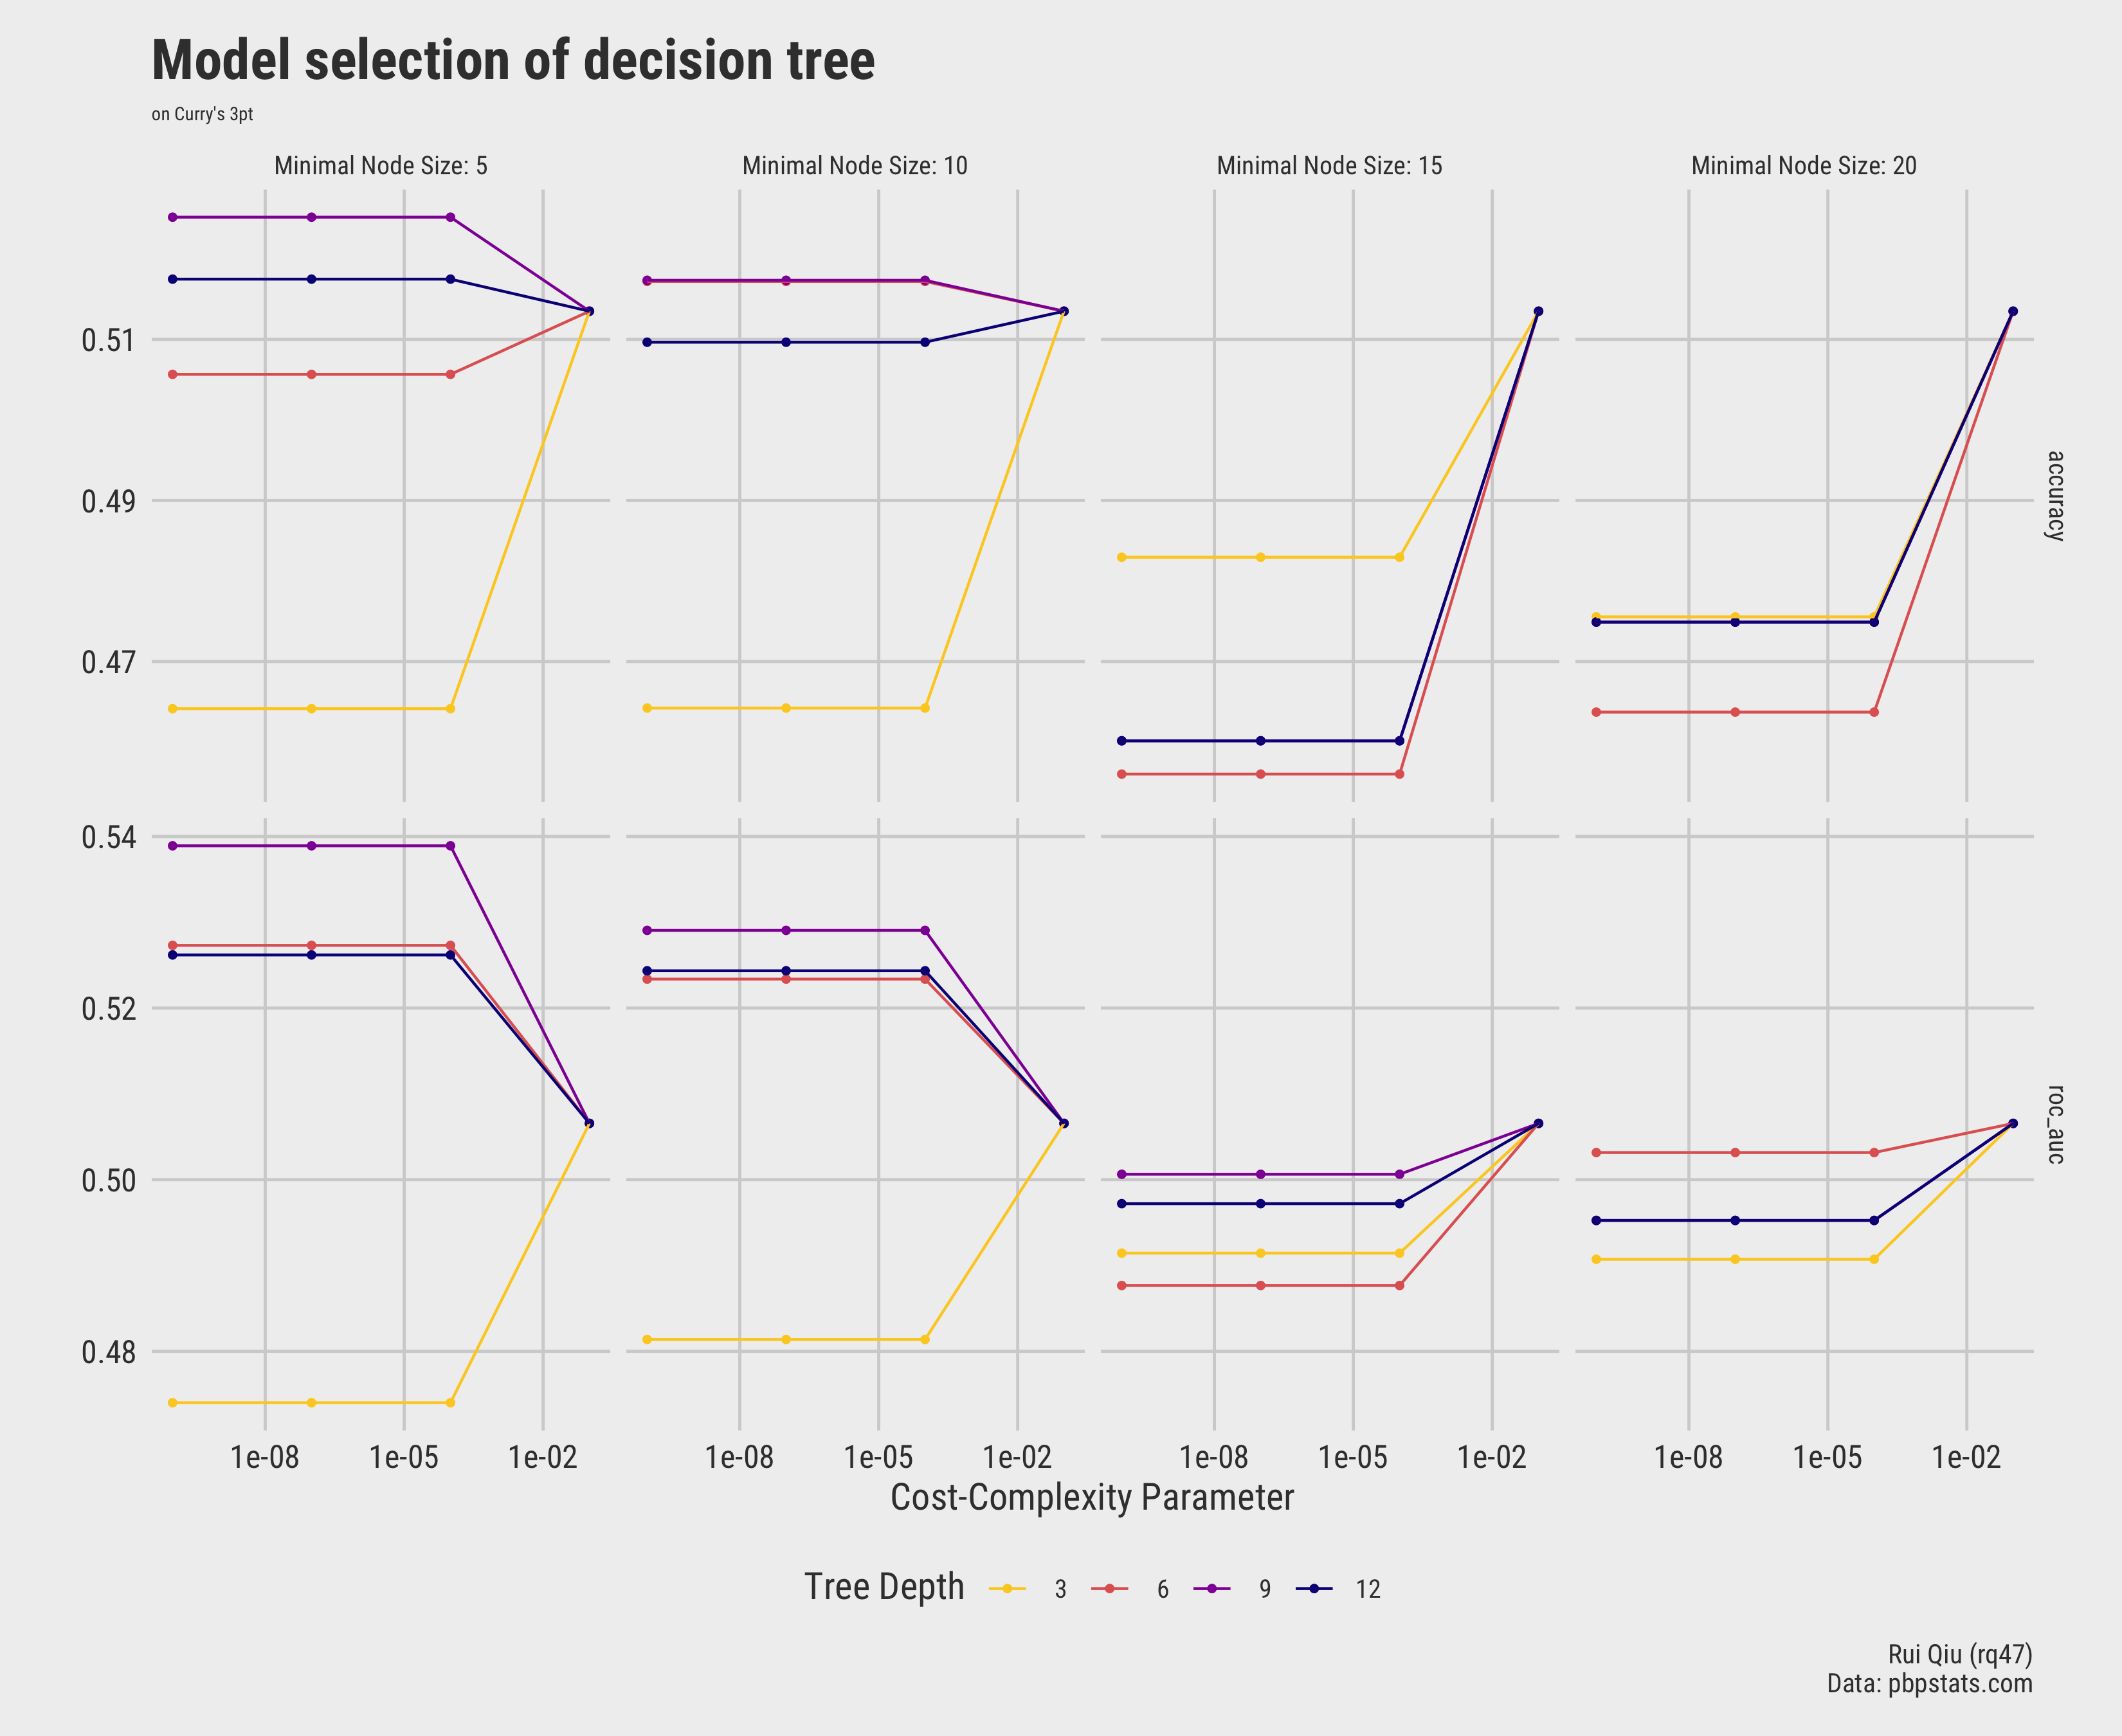
Open in new tab to see in full size.
And this can be automated by commands too.
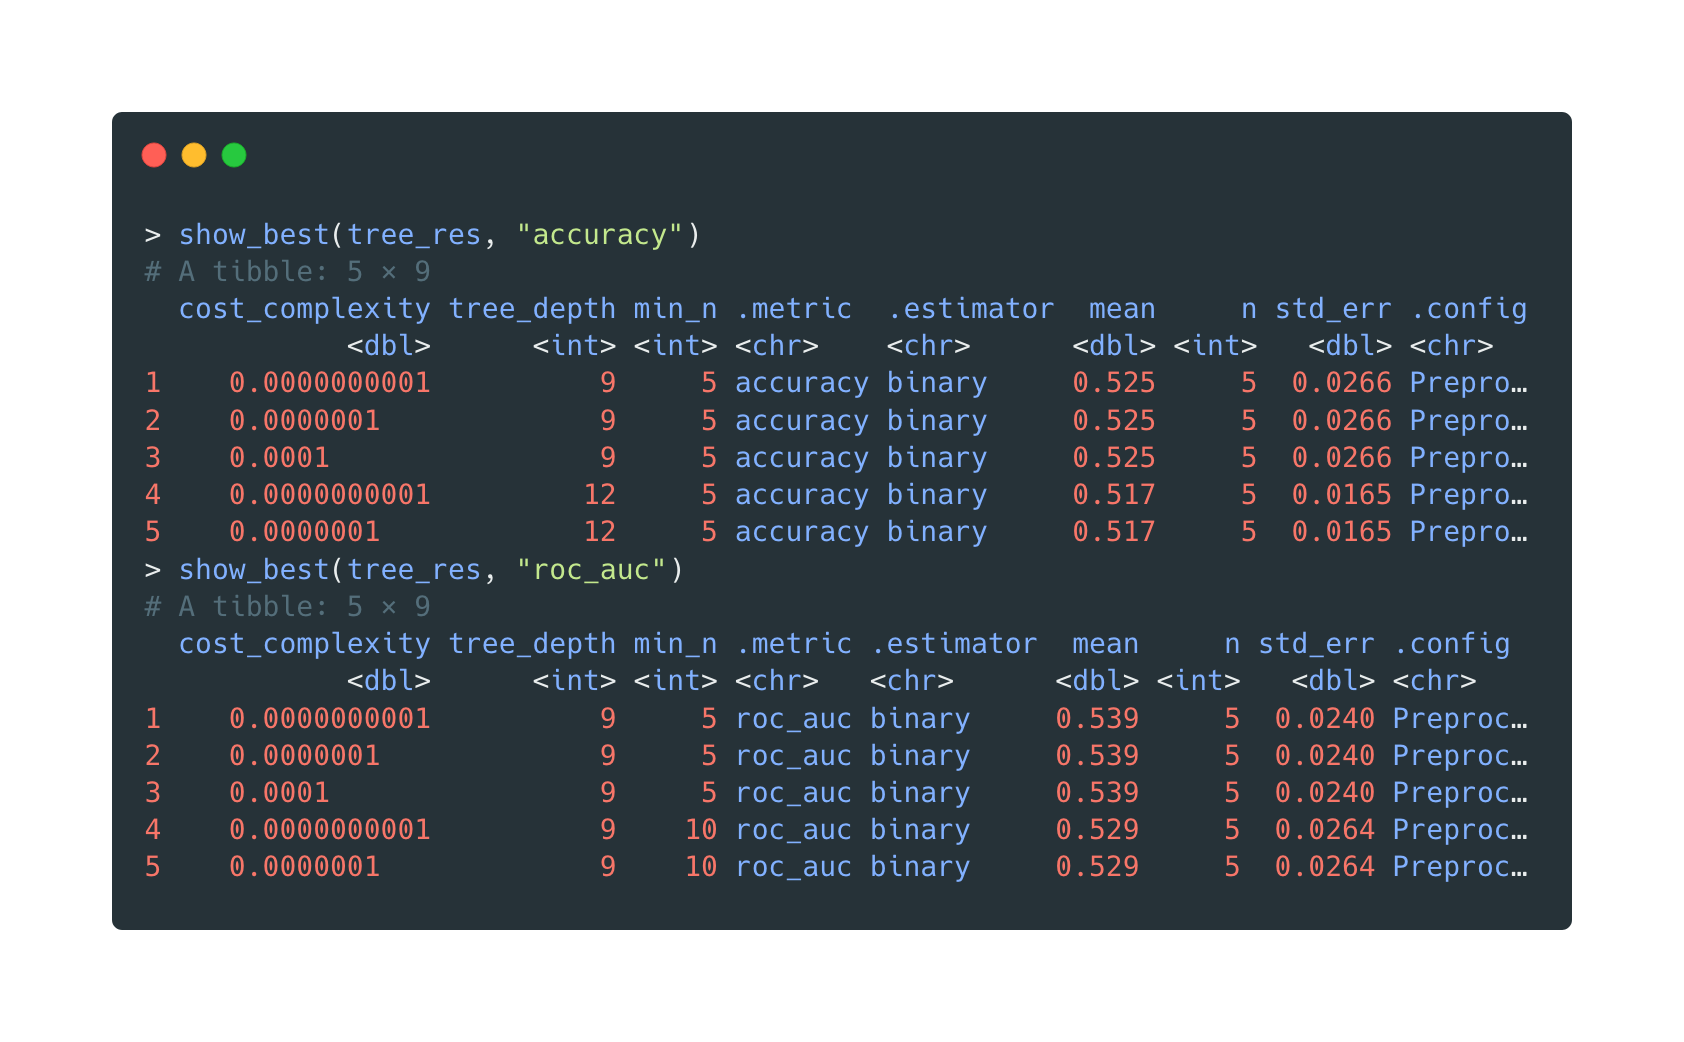
Open in new tab to see in full size.
In the following sections, the metrics accuracy and
roc_auc are selected respectively as the tree picking criteria.
tree1: selected by accuracy
Warning: I’ve been trying really hard to elegantly visualize a rpart object with the available R packages. Unfortunately, there are no good ones compatible with
{ggplot2}yet, so I cannot really tweak the plot in my familiar syntax. Plus, the trees generated here are really complex; the final output seems to be very messy. Therefore, as a result, the resolution is not optimal.
Note that since the two metrics overlap in selecting the best model available, we decide to keep the optimal one for
roc_aucand choose the fourth-best byaccuracy.
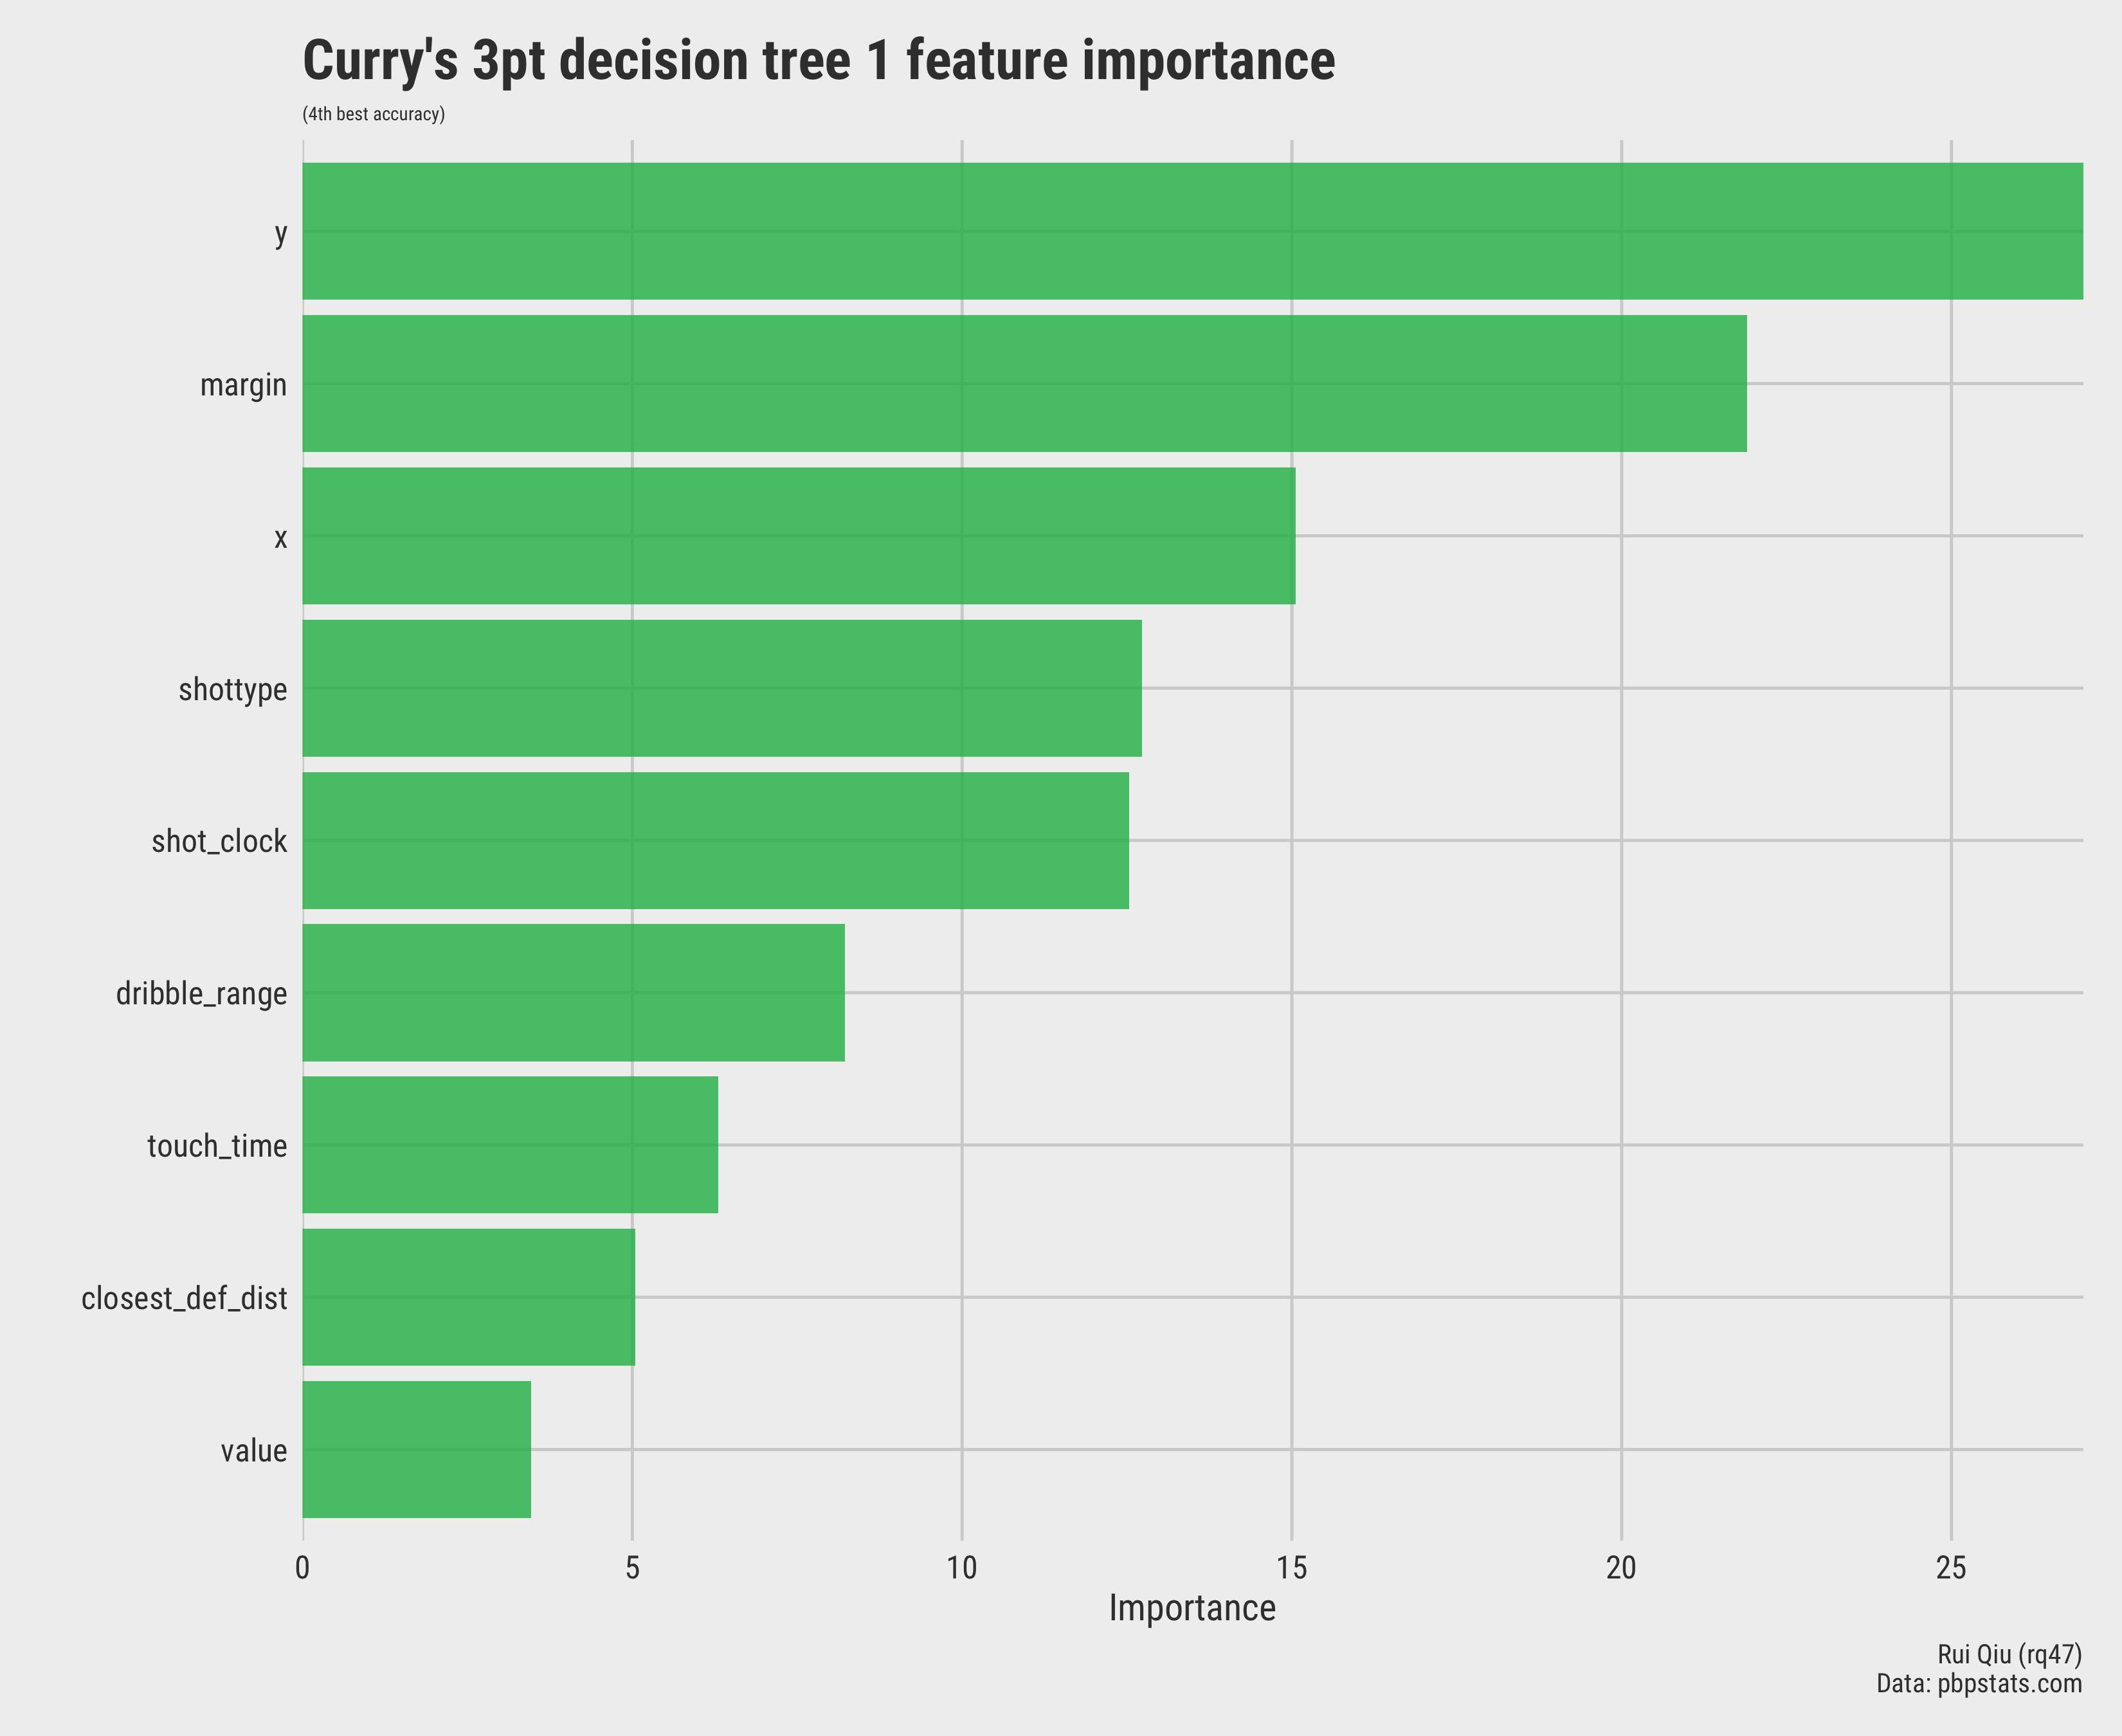
The first tree is picked by selecting the fourth-best model ranking by model’s accuracy on training data.
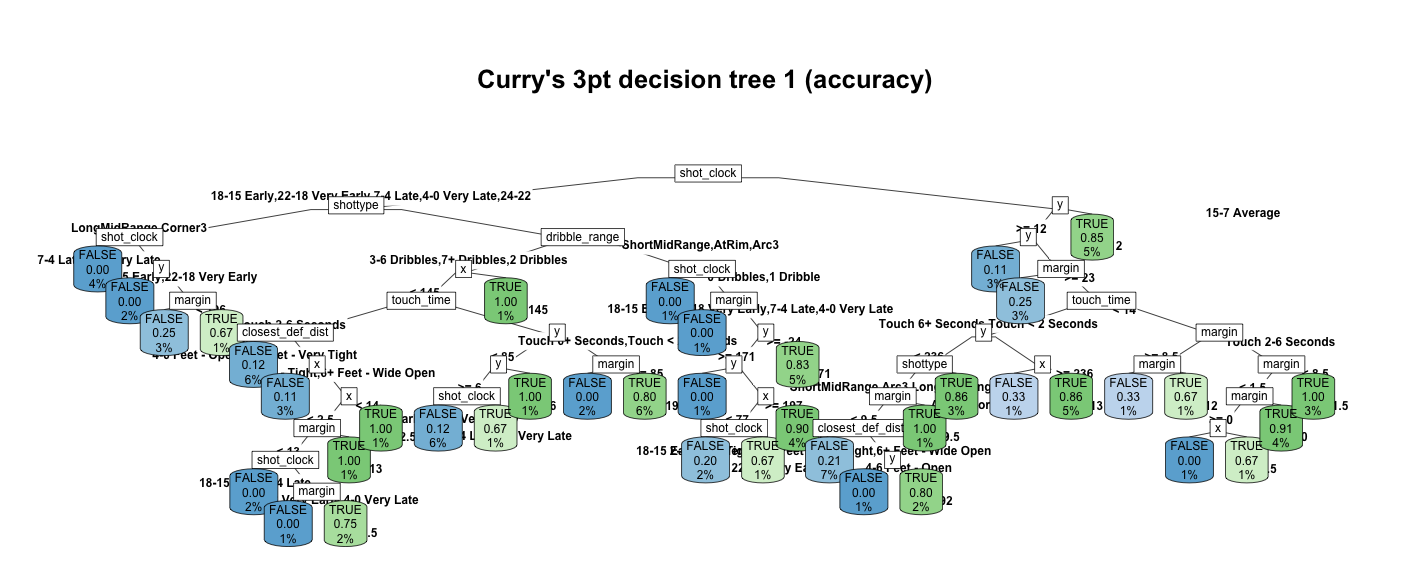
Open in new tab to see in full size.
Its feature importance is ranked like this:
Open in new tab to see in full size.
It seems that the variable y (the coordinate that indicates the vertical
distance), margin (leading or trailing in scores), and
x
(the coordinate that means the horizontal distance) are the top three variables that determine if
Stephen’s
shot scores or not.
Open in new tab to see in full size.
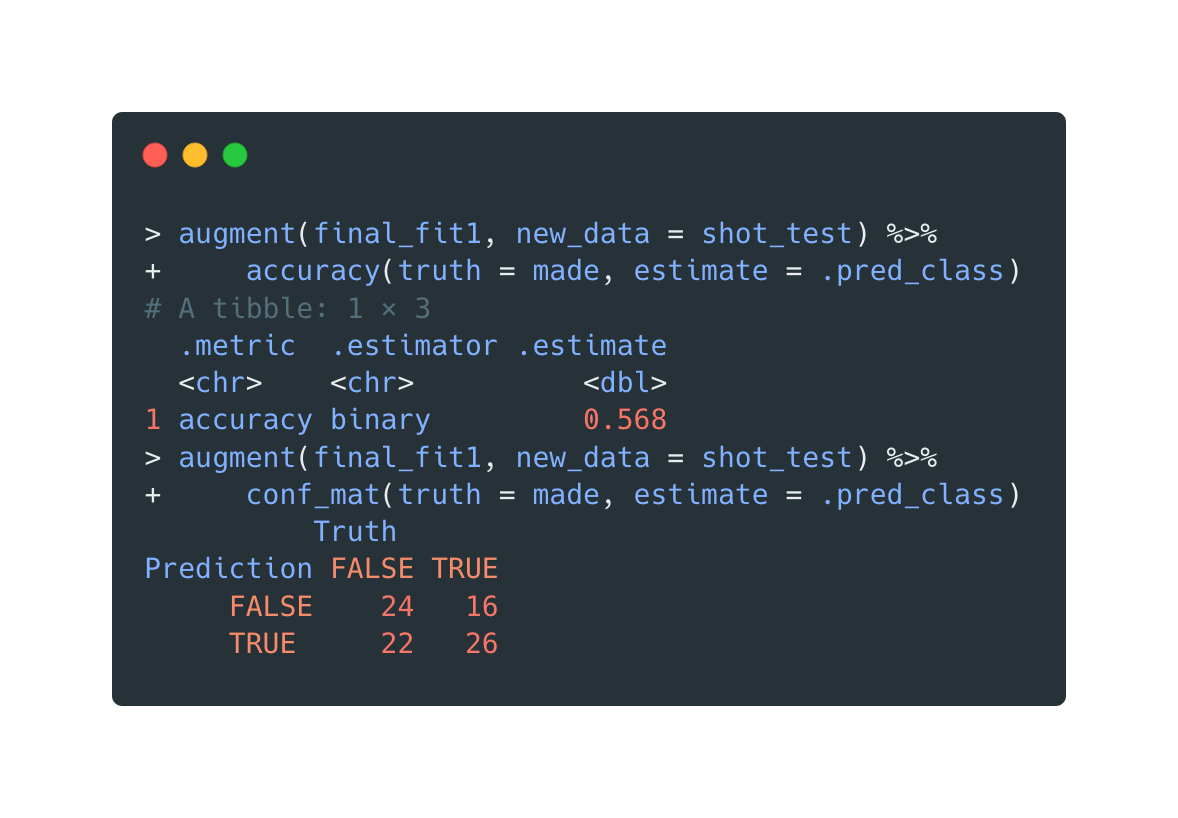
And finally, a test run is carried out on testing data, and a corresponding confusion matrix is generated.
The in-sample accuracy is (24+26)/(24+26+22+16)=0.57
tree2: selected by roc_auc
Similarly, for the second tree, the metric used here is roc_auc.
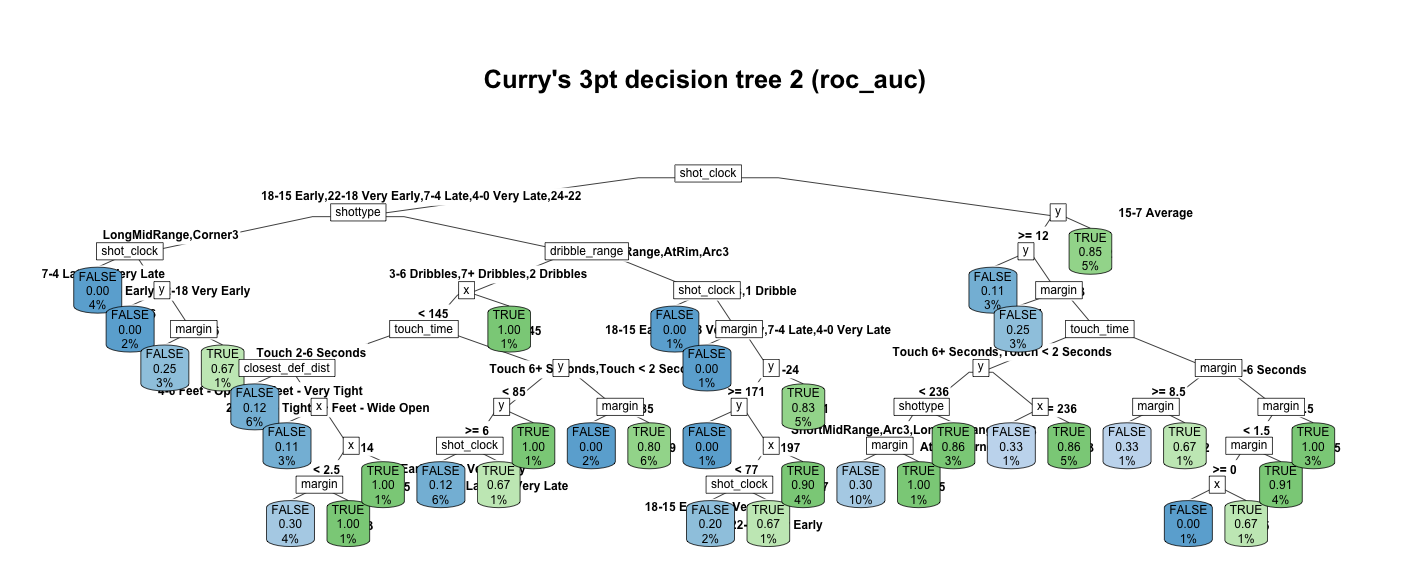
Open in new tab to see in full size.
The feature importance constitution remains unchanged.
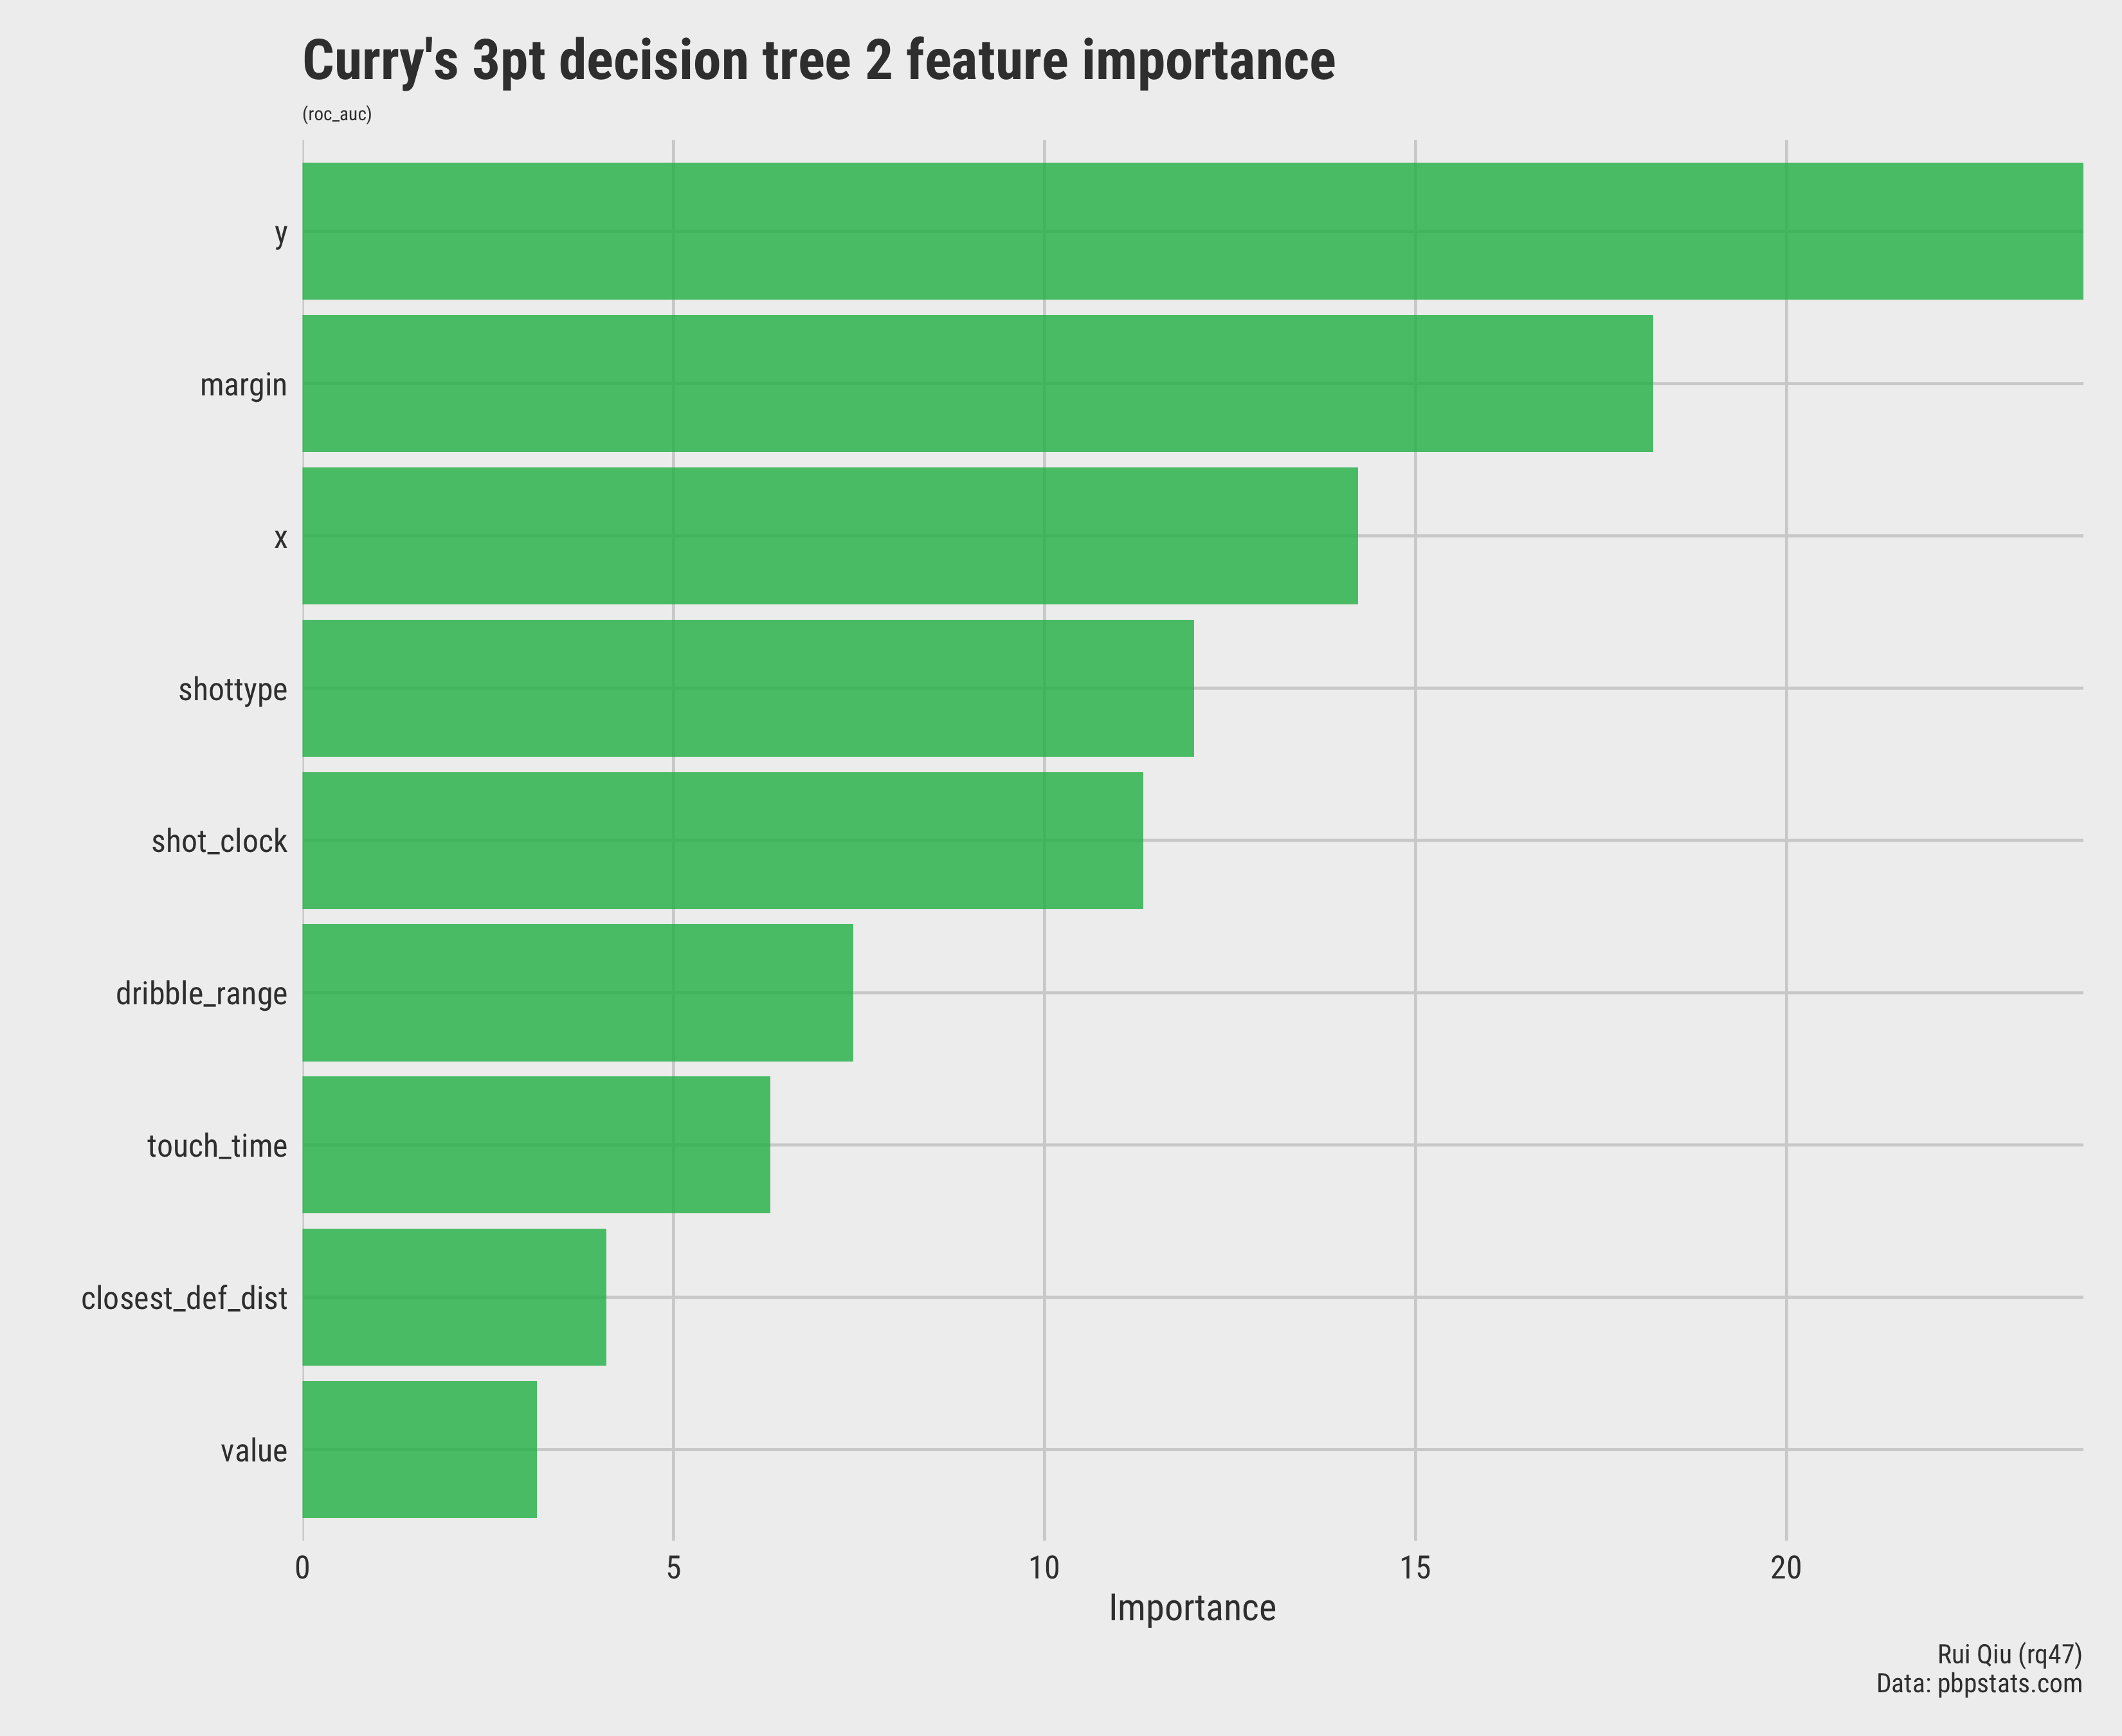
Open in new tab to see in full size.
The order stays the same, but the relative importance. Coincidentally, both decision trees have very similar performance on testing data.

Open in new tab to see in full size.
The in-sample accuracy is (27+23)/(27+23+19+19)=0.57
Although the true positive, true negative allocations are different from the previous decision tree, the final in-sample accuracy is the same. Probably the accuracy won't stay the same for a larger sample.
tree3: hack
The same hack is applied to the complete data set for the third tree, which means the decision tree is trained with all the available data. In reality, this is risky due to overfitting. Nonetheless, this is a test run. The third tree looks like this:
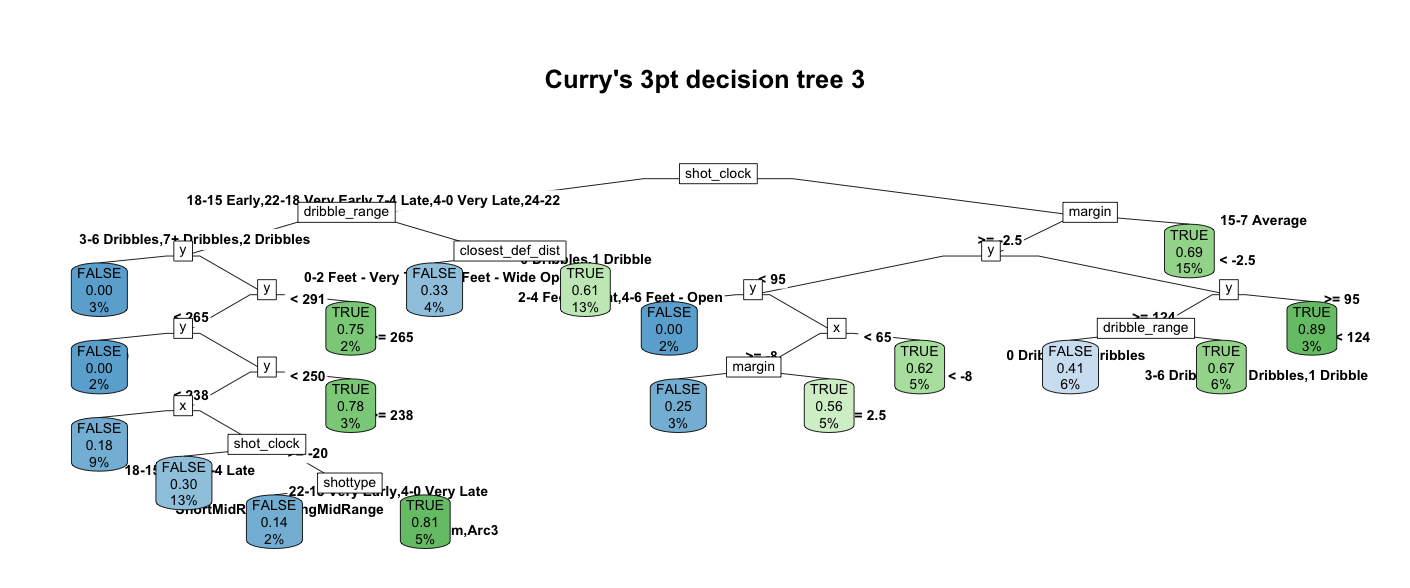
Open in new tab to see in full size.
This time the feature importance varies a lot. Both the shot_type and
shot_clock are becoming the more critical speakers when making
decisions.
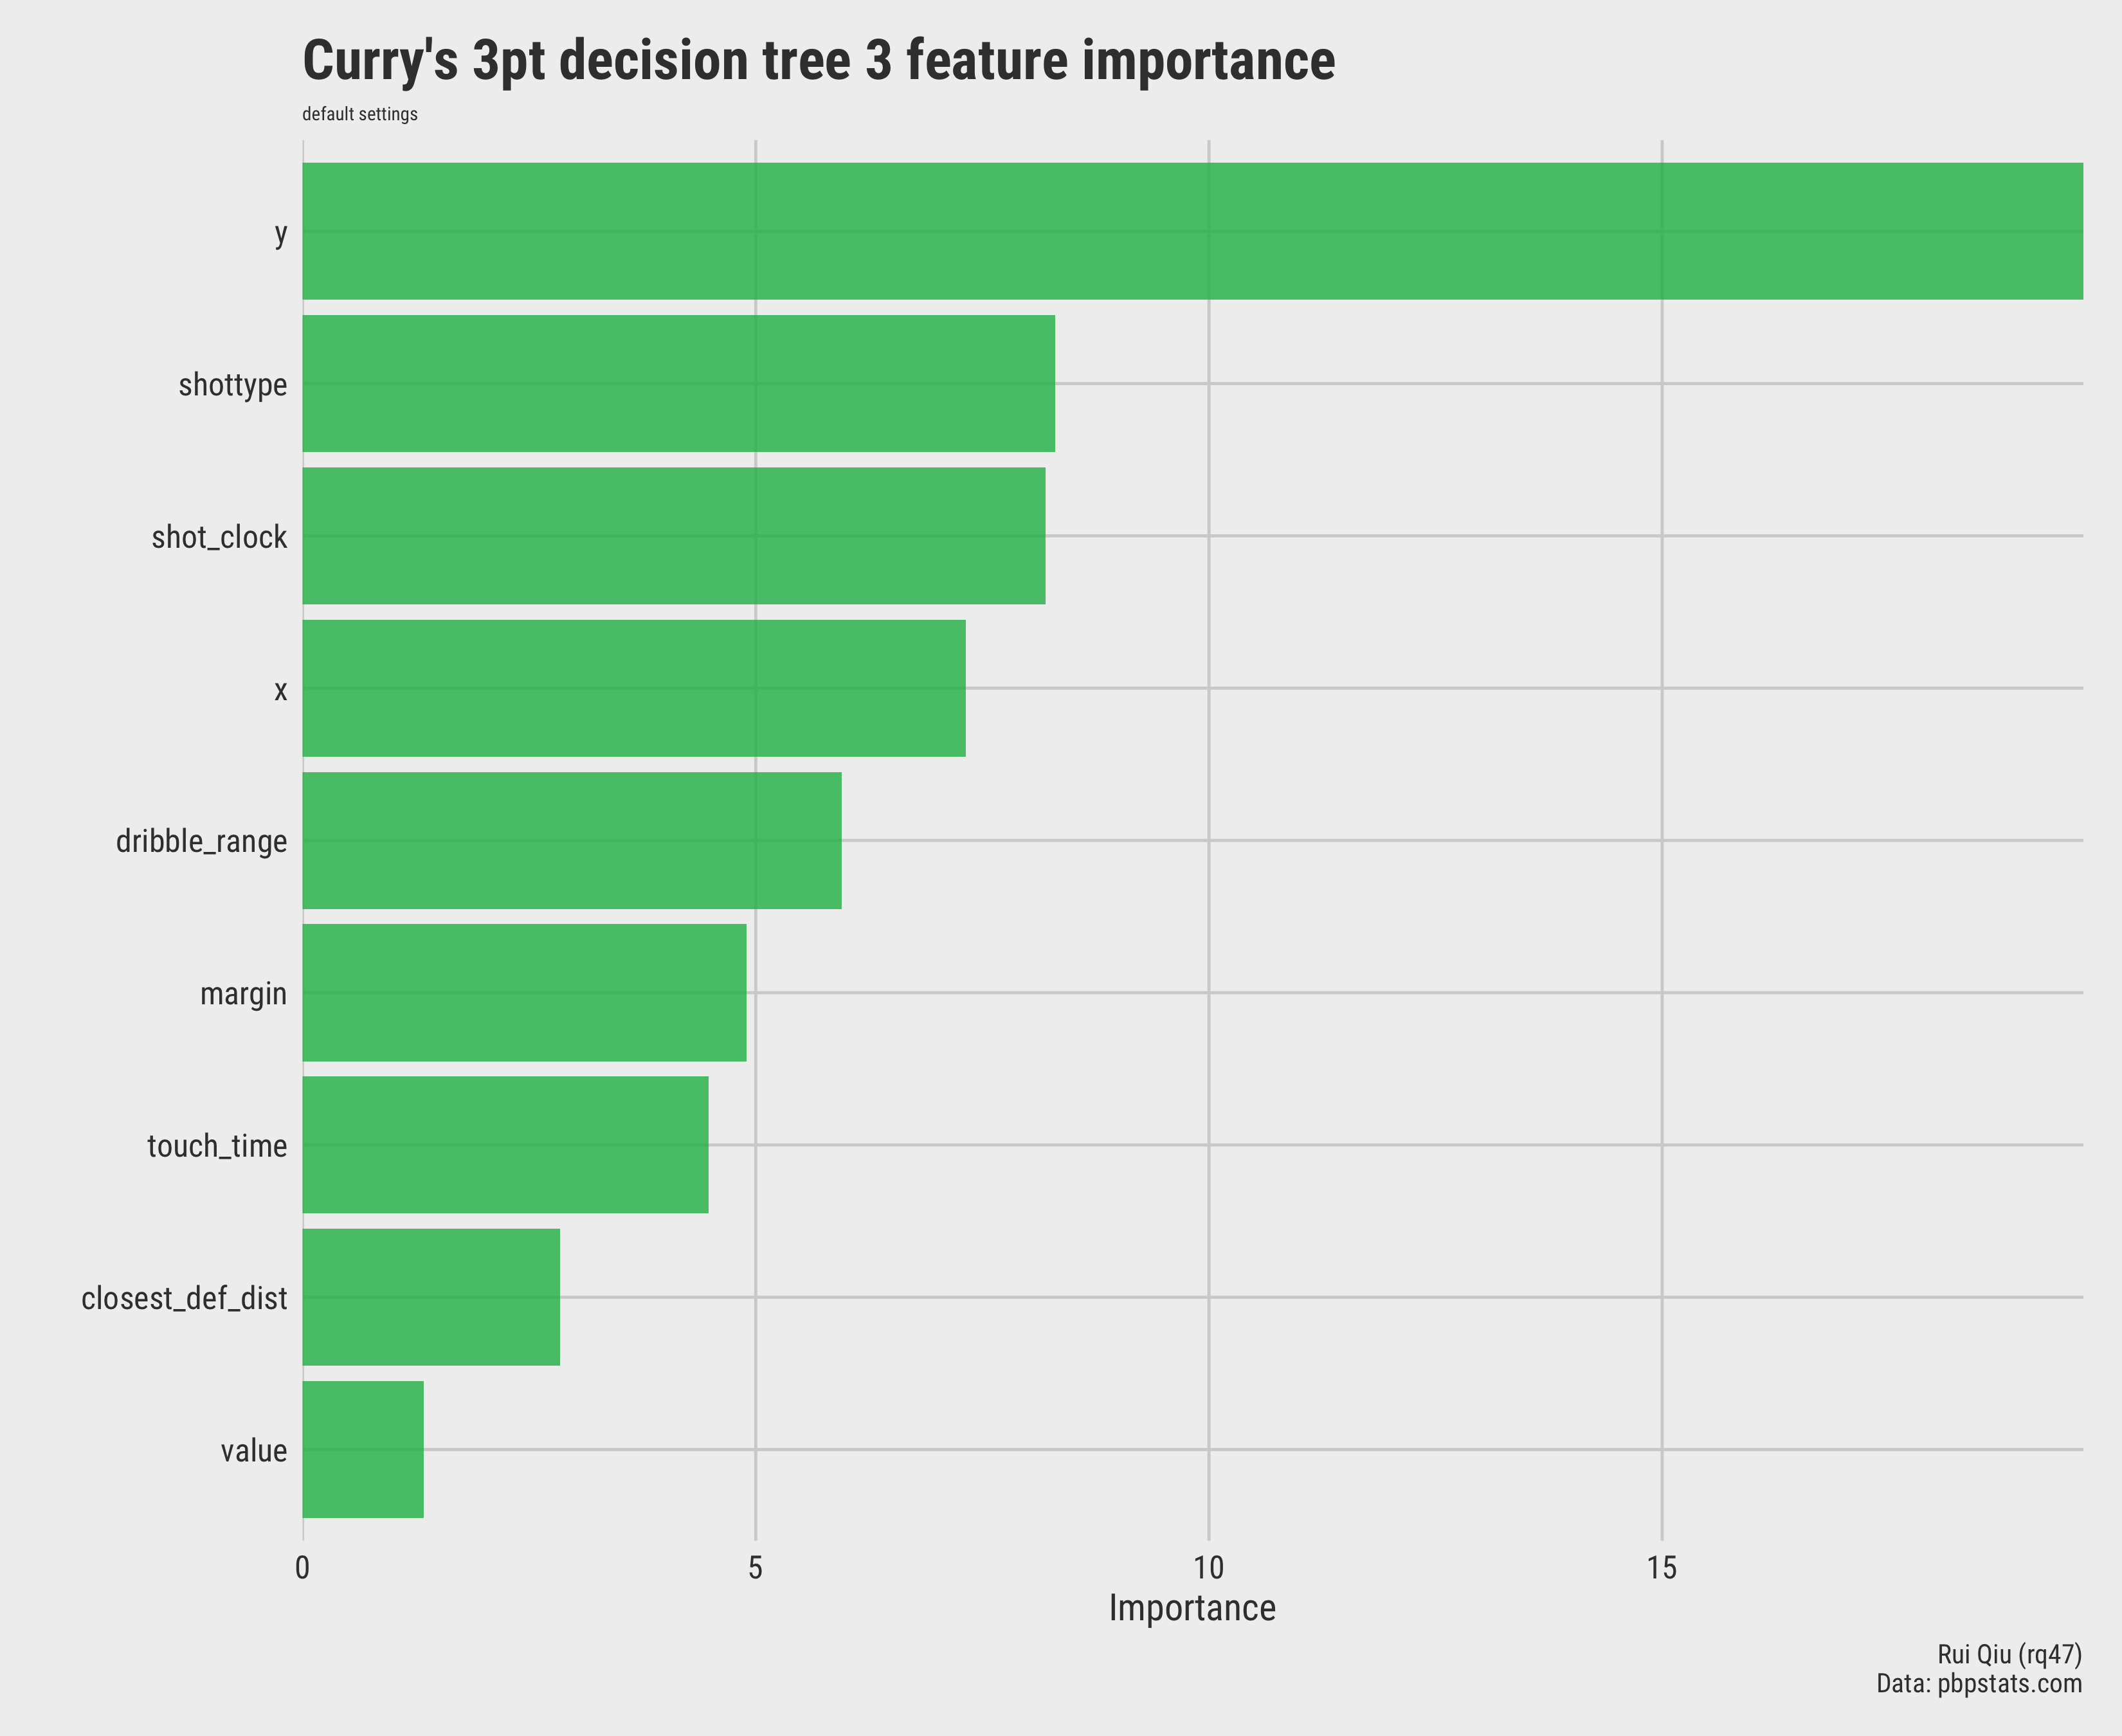
Open in new tab to see in full size.
The performance, as expected, is better than the previous two. Apparently, this is the result of overfitting. Such a model could be extremely good-looking if it “remembers” everything it learned. That’s technically not a “prediction,” though.
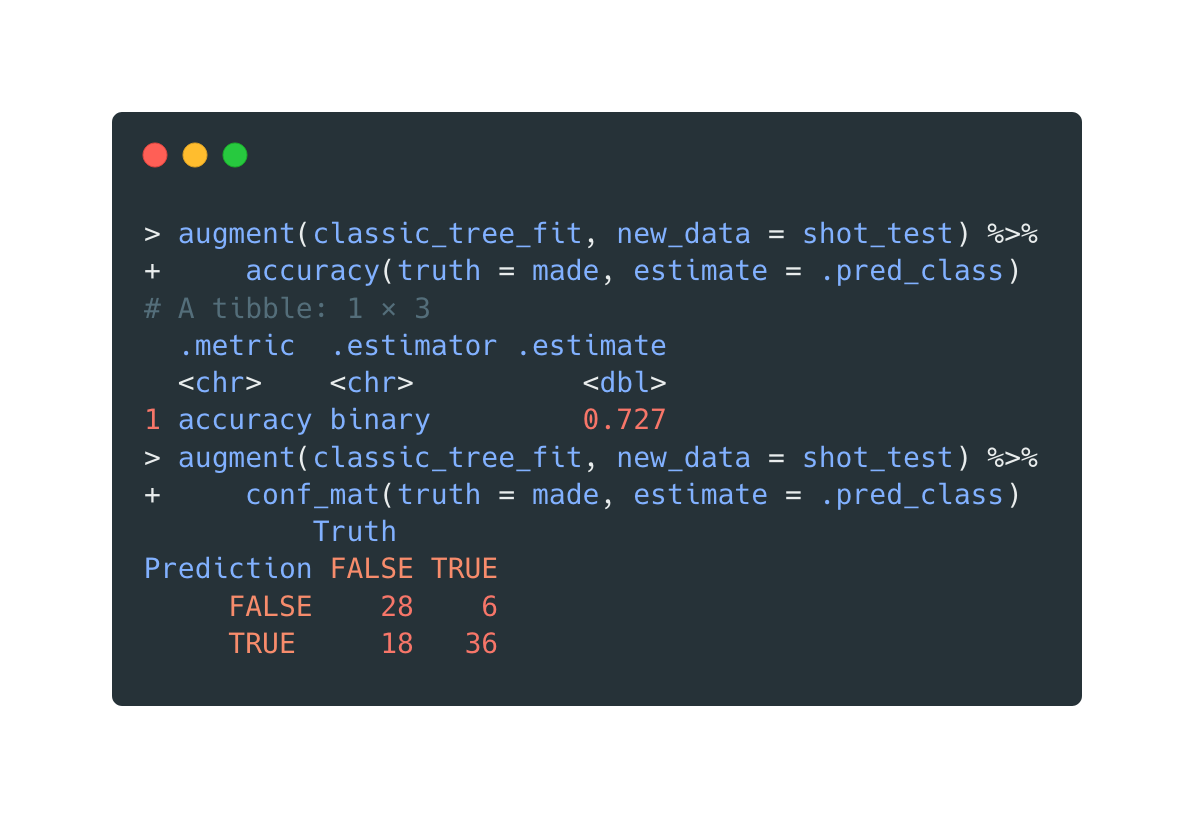
Open in new tab to see in full size.
The in-sample accuracy is (28+36)/(28+36+6+18)=0.73
Comparison of 3 DT on mixed data
A quick and dirty radar plot would be perfect for feature importance comparison among the three decision tree models.
Tree1 and tree2 both share a very similar feature composition, as tree3 is the odd one.
The accuracy calculated by a confusion matrix tells the same story.
- The accuracy of tree1 is (24+26)/(24+16+22+26) = 0.568
- The accuracy of tree2 is (27+23)/(27+23+19+19) = 0.568
- The accuracy of tree3 is (28+36)/(28+36+6+18) = 0.727
The tree3 has the best accuracy on paper. However, this is due to the inclusion of all data available. And it's strange to see even the two models of tree1 and tree2 have different parameters, they still look alike in many ways such as the tree structure, feature importance and final accuracy. They are definitely not identical, as the confusion matrices also suggest. Maybe add more levels in the grid search would result in more combinations of model parameters so that a better model would finally emerge.
Summary (of two predictions)
Frankly speaking, decision trees are useful and interpretable supervised learning for some simple tasks, both classification and regression. However, nothing is truly omnipotent. Impaired performance on those two scenarios above definitely exposes the drawbacks of decision trees.
Decision trees are sensitive to small perturbations. The trees are interpretable but could vary dramatically. Furthermore, trees are overfitting-prone. In addition, they don’t handle out-of-sample predictions well.
For instance, if a new category of Reddit threads upvote ratio is introduced, or a new scenario of shot attempt is brought up, any decision tree model built above will just randomly guess the result. Something new to them is just something new to us. When we face the unknown, we take a guess.
But luckily, as the big brother of decision trees, the random forest might just be the easily reachable solution. And it will be discussed in another part of the portfolio.
So, back to the topic, some other thoughts might not be closely affiliated with this part but are worth discussing:
- A predictive model for guessing if a shot can be made has an accuracy slightly higher than 50%. Is it good?
- Does that mean another model based on tossing a coin is basically the same as it?
- Maybe taking a player’s field goal percentage is a good idea when building a specific decision tree for him.
- As for the prediction of upvotes of a Reddit post, some non-textual data might be a excellent addition to the model, like the general popularity of that subreddit, the media type of that thread, the posting time, etc.